Immigrants from Senegal vs Alsatian Female Poverty
COMPARE
Immigrants from Senegal
Alsatian
Female Poverty
Female Poverty Comparison
Immigrants from Senegal
Alsatians
16.5%
FEMALE POVERTY
0.0/ 100
METRIC RATING
296th/ 347
METRIC RANK
14.5%
FEMALE POVERTY
4.0/ 100
METRIC RATING
220th/ 347
METRIC RANK
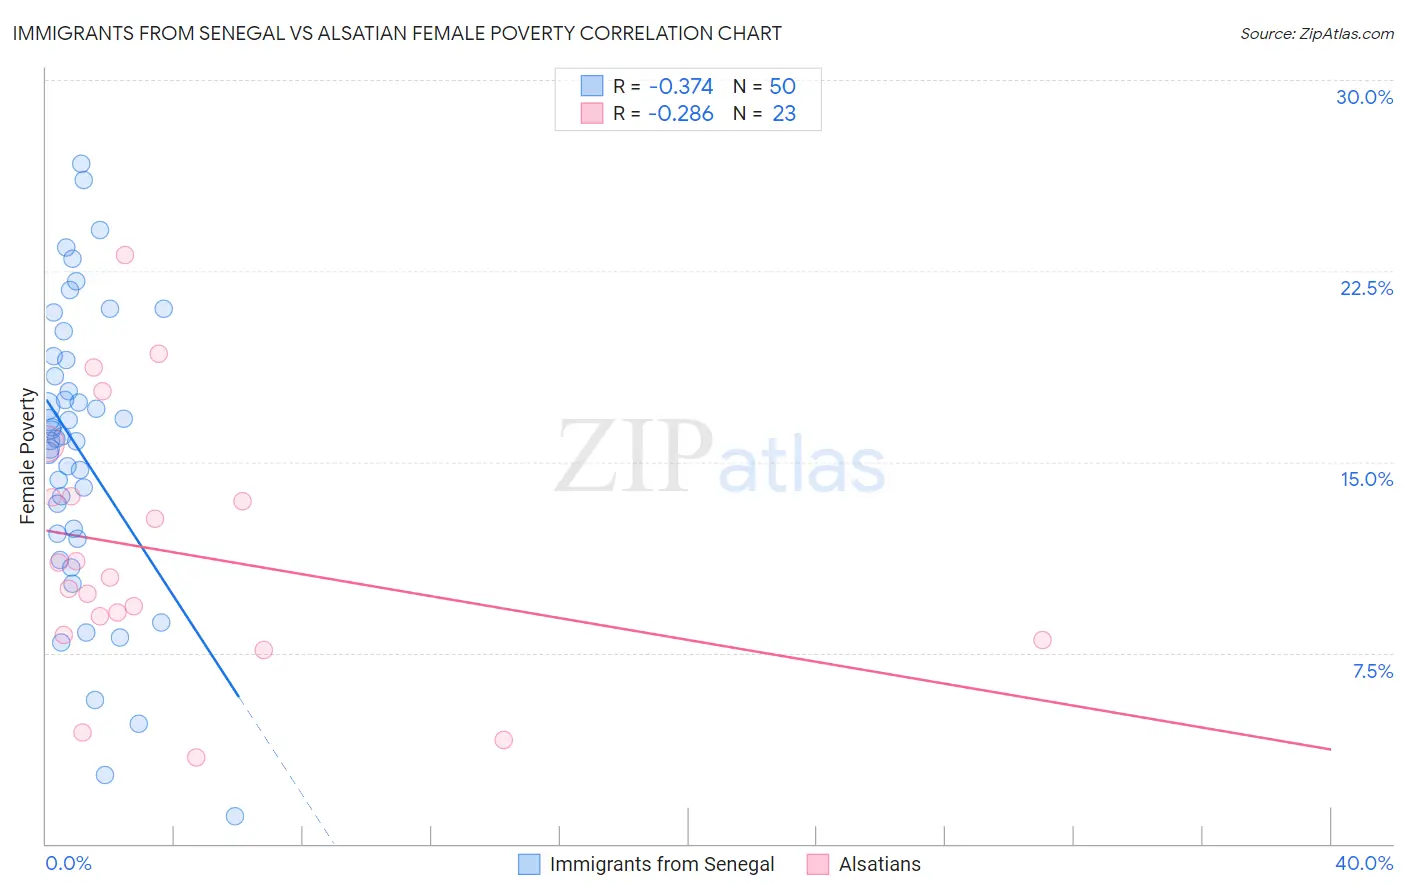
Immigrants from Senegal vs Alsatian Female Poverty Correlation Chart
The statistical analysis conducted on geographies consisting of 90,102,855 people shows a mild negative correlation between the proportion of Immigrants from Senegal and poverty level among females in the United States with a correlation coefficient (R) of -0.374 and weighted average of 16.5%. Similarly, the statistical analysis conducted on geographies consisting of 82,678,421 people shows a weak negative correlation between the proportion of Alsatians and poverty level among females in the United States with a correlation coefficient (R) of -0.286 and weighted average of 14.5%, a difference of 13.8%.
Female Poverty Correlation Summary
| Measurement | Immigrants from Senegal | Alsatian |
| Minimum | 1.1% | 3.4% |
| Maximum | 26.7% | 23.1% |
| Range | 25.6% | 19.7% |
| Mean | 15.4% | 11.5% |
| Median | 16.0% | 10.5% |
| Interquartile 25% (IQ1) | 12.2% | 8.2% |
| Interquartile 75% (IQ3) | 19.0% | 13.7% |
| Interquartile Range (IQR) | 6.8% | 5.5% |
| Standard Deviation (Sample) | 5.7% | 5.0% |
| Standard Deviation (Population) | 5.6% | 4.9% |
Similar Demographics by Female Poverty
Demographics Similar to Immigrants from Senegal by Female Poverty
In terms of female poverty, the demographic groups most similar to Immigrants from Senegal are Senegalese (16.5%, a difference of 0.020%), Immigrants from Cabo Verde (16.4%, a difference of 0.10%), Immigrants from Latin America (16.4%, a difference of 0.13%), Immigrants from Zaire (16.4%, a difference of 0.19%), and Yaqui (16.4%, a difference of 0.20%).
| Demographics | Rating | Rank | Female Poverty |
| Blackfeet | 0.0 /100 | #289 | Tragic 16.4% |
| Immigrants | Bangladesh | 0.0 /100 | #290 | Tragic 16.4% |
| Yaqui | 0.0 /100 | #291 | Tragic 16.4% |
| Immigrants | Zaire | 0.0 /100 | #292 | Tragic 16.4% |
| Immigrants | Latin America | 0.0 /100 | #293 | Tragic 16.4% |
| Immigrants | Cabo Verde | 0.0 /100 | #294 | Tragic 16.4% |
| Senegalese | 0.0 /100 | #295 | Tragic 16.5% |
| Immigrants | Senegal | 0.0 /100 | #296 | Tragic 16.5% |
| Mexicans | 0.0 /100 | #297 | Tragic 16.5% |
| Somalis | 0.0 /100 | #298 | Tragic 16.6% |
| Hispanics or Latinos | 0.0 /100 | #299 | Tragic 16.6% |
| Bahamians | 0.0 /100 | #300 | Tragic 16.6% |
| Guatemalans | 0.0 /100 | #301 | Tragic 16.7% |
| Chippewa | 0.0 /100 | #302 | Tragic 16.7% |
| Choctaw | 0.0 /100 | #303 | Tragic 16.8% |
Demographics Similar to Alsatians by Female Poverty
In terms of female poverty, the demographic groups most similar to Alsatians are Japanese (14.5%, a difference of 0.050%), Immigrants from Uzbekistan (14.4%, a difference of 0.18%), Immigrants from Cambodia (14.5%, a difference of 0.19%), Nonimmigrants (14.5%, a difference of 0.22%), and Immigrants (14.4%, a difference of 0.23%).
| Demographics | Rating | Rank | Female Poverty |
| Alaskan Athabascans | 5.3 /100 | #213 | Tragic 14.4% |
| Marshallese | 5.0 /100 | #214 | Tragic 14.4% |
| Immigrants | Panama | 4.7 /100 | #215 | Tragic 14.4% |
| Immigrants | Thailand | 4.5 /100 | #216 | Tragic 14.4% |
| Immigrants | Immigrants | 4.5 /100 | #217 | Tragic 14.4% |
| Immigrants | Uzbekistan | 4.4 /100 | #218 | Tragic 14.4% |
| Japanese | 4.1 /100 | #219 | Tragic 14.5% |
| Alsatians | 4.0 /100 | #220 | Tragic 14.5% |
| Immigrants | Cambodia | 3.7 /100 | #221 | Tragic 14.5% |
| Immigrants | Nonimmigrants | 3.7 /100 | #222 | Tragic 14.5% |
| Immigrants | Africa | 3.3 /100 | #223 | Tragic 14.5% |
| Americans | 2.8 /100 | #224 | Tragic 14.6% |
| Immigrants | Micronesia | 2.8 /100 | #225 | Tragic 14.6% |
| Immigrants | Eritrea | 2.4 /100 | #226 | Tragic 14.6% |
| Immigrants | Nigeria | 2.1 /100 | #227 | Tragic 14.7% |