Immigrants from Saudi Arabia vs Immigrants from Austria Single Male Poverty
COMPARE
Immigrants from Saudi Arabia
Immigrants from Austria
Single Male Poverty
Single Male Poverty Comparison
Immigrants from Saudi Arabia
Immigrants from Austria
14.0%
SINGLE MALE POVERTY
0.1/ 100
METRIC RATING
270th/ 347
METRIC RANK
12.5%
SINGLE MALE POVERTY
81.9/ 100
METRIC RATING
136th/ 347
METRIC RANK
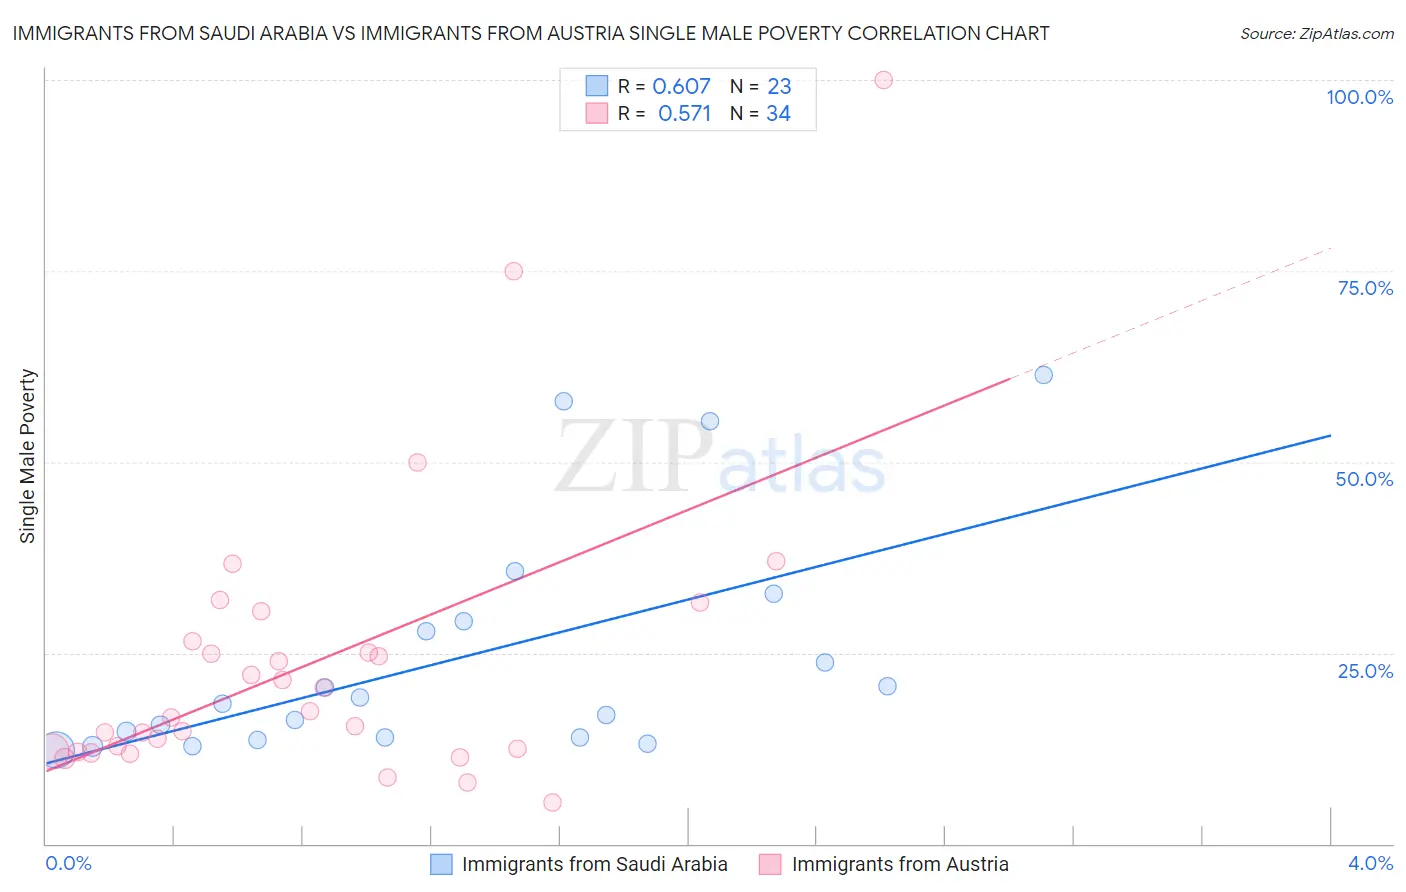
Immigrants from Saudi Arabia vs Immigrants from Austria Single Male Poverty Correlation Chart
The statistical analysis conducted on geographies consisting of 155,832,907 people shows a significant positive correlation between the proportion of Immigrants from Saudi Arabia and poverty level among single males in the United States with a correlation coefficient (R) of 0.607 and weighted average of 14.0%. Similarly, the statistical analysis conducted on geographies consisting of 154,466,694 people shows a substantial positive correlation between the proportion of Immigrants from Austria and poverty level among single males in the United States with a correlation coefficient (R) of 0.571 and weighted average of 12.5%, a difference of 11.4%.
Single Male Poverty Correlation Summary
| Measurement | Immigrants from Saudi Arabia | Immigrants from Austria |
| Minimum | 12.2% | 5.5% |
| Maximum | 61.3% | 100.0% |
| Range | 49.1% | 94.5% |
| Mean | 24.3% | 23.7% |
| Median | 18.3% | 17.0% |
| Interquartile 25% (IQ1) | 13.9% | 12.1% |
| Interquartile 75% (IQ3) | 29.1% | 26.6% |
| Interquartile Range (IQR) | 15.3% | 14.4% |
| Standard Deviation (Sample) | 15.0% | 19.2% |
| Standard Deviation (Population) | 14.7% | 18.9% |
Similar Demographics by Single Male Poverty
Demographics Similar to Immigrants from Saudi Arabia by Single Male Poverty
In terms of single male poverty, the demographic groups most similar to Immigrants from Saudi Arabia are Scottish (14.0%, a difference of 0.010%), Irish (14.0%, a difference of 0.030%), Mexican (14.0%, a difference of 0.090%), Immigrants from Mexico (13.9%, a difference of 0.17%), and German (13.9%, a difference of 0.23%).
| Demographics | Rating | Rank | Single Male Poverty |
| Cape Verdeans | 0.2 /100 | #263 | Tragic 13.8% |
| West Indians | 0.2 /100 | #264 | Tragic 13.8% |
| Immigrants | Congo | 0.2 /100 | #265 | Tragic 13.9% |
| Immigrants | Cabo Verde | 0.1 /100 | #266 | Tragic 13.9% |
| Germans | 0.1 /100 | #267 | Tragic 13.9% |
| Immigrants | Mexico | 0.1 /100 | #268 | Tragic 13.9% |
| Scottish | 0.1 /100 | #269 | Tragic 14.0% |
| Immigrants | Saudi Arabia | 0.1 /100 | #270 | Tragic 14.0% |
| Irish | 0.1 /100 | #271 | Tragic 14.0% |
| Mexicans | 0.1 /100 | #272 | Tragic 14.0% |
| Welsh | 0.1 /100 | #273 | Tragic 14.0% |
| Hondurans | 0.1 /100 | #274 | Tragic 14.0% |
| English | 0.1 /100 | #275 | Tragic 14.1% |
| Dutch | 0.1 /100 | #276 | Tragic 14.1% |
| Immigrants | Honduras | 0.0 /100 | #277 | Tragic 14.1% |
Demographics Similar to Immigrants from Austria by Single Male Poverty
In terms of single male poverty, the demographic groups most similar to Immigrants from Austria are Immigrants from Costa Rica (12.5%, a difference of 0.0%), Immigrants from Ecuador (12.5%, a difference of 0.010%), Ukrainian (12.6%, a difference of 0.11%), Immigrants from Western Asia (12.5%, a difference of 0.14%), and Immigrants from El Salvador (12.6%, a difference of 0.16%).
| Demographics | Rating | Rank | Single Male Poverty |
| Immigrants | Sierra Leone | 85.5 /100 | #129 | Excellent 12.5% |
| Immigrants | Nicaragua | 84.8 /100 | #130 | Excellent 12.5% |
| Immigrants | Northern Europe | 83.7 /100 | #131 | Excellent 12.5% |
| Salvadorans | 83.7 /100 | #132 | Excellent 12.5% |
| Immigrants | Western Asia | 83.4 /100 | #133 | Excellent 12.5% |
| Immigrants | Ecuador | 82.1 /100 | #134 | Excellent 12.5% |
| Immigrants | Costa Rica | 81.9 /100 | #135 | Excellent 12.5% |
| Immigrants | Austria | 81.9 /100 | #136 | Excellent 12.5% |
| Ukrainians | 80.7 /100 | #137 | Excellent 12.6% |
| Immigrants | El Salvador | 80.0 /100 | #138 | Excellent 12.6% |
| Cubans | 79.9 /100 | #139 | Good 12.6% |
| Immigrants | Zimbabwe | 78.0 /100 | #140 | Good 12.6% |
| Okinawans | 75.9 /100 | #141 | Good 12.6% |
| Immigrants | Uganda | 75.9 /100 | #142 | Good 12.6% |
| Immigrants | France | 75.8 /100 | #143 | Good 12.6% |