Immigrants from Saudi Arabia vs Ghanaian Female Poverty Among 25-34 Year Olds

COMPARE

Immigrants from Saudi Arabia
Race
Ancestry
AfghanAfricanAlaska NativeAlaskan AthabascanAlbanianAleutAlsatianAmericanApacheArabArapahoArgentineanArmenianAssyrian/Chaldean/SyriacAustralianAustrianBahamianBangladeshiBarbadianBasqueBelgianBelizeanBermudanBhutaneseBlackfeetBolivianBrazilianBritishBritish West IndianBulgarianBurmeseCajunCambodianCanadianCape VerdeanCarpatho RusynCelticCentral AmericanCentral American IndianCherokeeCheyenneChickasawChileanChineseChippewaChoctawColombianColvilleComancheCosta RicanCreeCreekCroatianCrowCubanCypriotCzechCzechoslovakianDanishDelawareDominicanDutchDutch West IndianEastern EuropeanEcuadorianEgyptianEnglishEstonianEthiopianEuropeanFijianFilipinoFinnishFrenchFrench American IndianFrench CanadianGermanGerman RussianGreekGuamanian/ChamorroGuatemalanGuyaneseHaitianHmongHonduranHopiHoumaHungarianIcelanderIndian (Asian)IndonesianInupiatIranianIraqiIrishIroquoisIsraeliItalianJamaicanJapaneseJordanianKenyanKiowaKoreanLaotianLatvianLebaneseLiberianLithuanianLumbeeLuxembourgerMacedonianMalaysianMalteseMarshalleseMenomineeMexicanMexican American IndianMongolianMoroccanNative HawaiianNavajoNepaleseNew ZealanderNicaraguanNigerianNorthern EuropeanNorwegianOkinawanOsageOttawaPaiutePakistaniPalestinianPanamanianParaguayanPennsylvania GermanPeruvianPimaPolishPortuguesePotawatomiPuebloPuerto RicanPuget Sound SalishRomanianRussianSalvadoranSamoanScandinavianScotch-IrishScottishSeminoleSenegaleseSerbianShoshoneSierra LeoneanSiouxSlavicSlovakSloveneSomaliSouth AfricanSouth AmericanSouth American IndianSoviet UnionSpaniardSpanishSpanish AmericanSpanish American IndianSri LankanSubsaharan AfricanSudaneseSwedishSwissSyrianTaiwaneseThaiTlingit-HaidaTohono O'OdhamTonganTrinidadian and TobagonianTsimshianTurkishU.S. Virgin IslanderUgandanUkrainianUruguayanUteVenezuelanVietnameseWelshWest IndianYakamaYaquiYugoslavianYumanYup'ikZimbabwean
Immigration
NonimmigrantsImmigrantsAfghanistanAfricaAlbaniaArgentinaArmeniaAsiaAustraliaAustriaBahamasBangladeshBarbadosBelarusBelgiumBelizeBoliviaBosnia and HerzegovinaBrazilBulgariaBurma/MyanmarCabo VerdeCambodiaCameroonCanadaCaribbeanCentral AmericaChileChinaColombiaCongoCosta RicaCroatiaCubaCzechoslovakiaDenmarkDominicaDominican RepublicEastern AfricaEastern AsiaEastern EuropeEcuadorEgyptEl SalvadorEnglandEritreaEthiopiaEuropeFijiFranceGermanyGhanaGreeceGrenadaGuatemalaGuyanaHaitiHondurasHong KongHungaryIndiaIndonesiaIranIraqIrelandIsraelItalyJamaicaJapanJordanKazakhstanKenyaKoreaKuwaitLaosLatin AmericaLatviaLebanonLiberiaLithuaniaMalaysiaMexicoMicronesiaMiddle AfricaMoldovaMoroccoNepalNetherlandsNicaraguaNigeriaNorth AmericaNorth MacedoniaNorthern AfricaNorthern EuropeNorwayOceaniaPakistanPanamaPeruPhilippinesPolandPortugalRomaniaRussiaSaudi ArabiaScotlandSenegalSerbiaSierra LeoneSingaporeSomaliaSouth AfricaSouth AmericaSouth Central AsiaSouth Eastern AsiaSouthern EuropeSpainSri LankaSt. Vincent and the GrenadinesSudanSwedenSwitzerlandSyriaTaiwanThailandTrinidad and TobagoTurkeyUgandaUkraineUruguayUzbekistanVenezuelaVietnamWest IndiesWestern AfricaWestern AsiaWestern EuropeYemenZaireZimbabweAzores
Ghanaian
Race
Ancestry
AfghanAfricanAlaska NativeAlaskan AthabascanAlbanianAleutAlsatianAmericanApacheArabArapahoArgentineanArmenianAssyrian/Chaldean/SyriacAustralianAustrianBahamianBangladeshiBarbadianBasqueBelgianBelizeanBermudanBhutaneseBlackfeetBolivianBrazilianBritishBritish West IndianBulgarianBurmeseCajunCambodianCanadianCape VerdeanCarpatho RusynCelticCentral AmericanCentral American IndianCherokeeCheyenneChickasawChileanChineseChippewaChoctawColombianColvilleComancheCosta RicanCreeCreekCroatianCrowCubanCypriotCzechCzechoslovakianDanishDelawareDominicanDutchDutch West IndianEastern EuropeanEcuadorianEgyptianEnglishEstonianEthiopianEuropeanFijianFilipinoFinnishFrenchFrench American IndianFrench CanadianGermanGerman RussianGhanaianGreekGuamanian/ChamorroGuatemalanGuyaneseHaitianHmongHonduranHopiHoumaHungarianIcelanderIndian (Asian)IndonesianInupiatIranianIraqiIrishIroquoisIsraeliItalianJamaicanJapaneseJordanianKenyanKiowaKoreanLaotianLatvianLebaneseLiberianLithuanianLumbeeLuxembourgerMacedonianMalaysianMalteseMarshalleseMenomineeMexicanMexican American IndianMongolianMoroccanNative HawaiianNavajoNepaleseNew ZealanderNicaraguanNigerianNorthern EuropeanNorwegianOkinawanOsageOttawaPaiutePakistaniPalestinianPanamanianParaguayanPennsylvania GermanPeruvianPimaPolishPortuguesePotawatomiPuebloPuerto RicanPuget Sound SalishRomanianRussianSalvadoranSamoanScandinavianScotch-IrishScottishSeminoleSenegaleseSerbianShoshoneSierra LeoneanSiouxSlavicSlovakSloveneSomaliSouth AfricanSouth AmericanSouth American IndianSoviet UnionSpaniardSpanishSpanish AmericanSpanish American IndianSri LankanSubsaharan AfricanSudaneseSwedishSwissSyrianTaiwaneseThaiTlingit-HaidaTohono O'OdhamTonganTrinidadian and TobagonianTsimshianTurkishU.S. Virgin IslanderUgandanUkrainianUruguayanUteVenezuelanVietnameseWelshWest IndianYakamaYaquiYugoslavianYumanYup'ikZimbabwean
Immigration
NonimmigrantsImmigrantsAfghanistanAfricaAlbaniaArgentinaArmeniaAsiaAustraliaAustriaBahamasBangladeshBarbadosBelarusBelgiumBelizeBoliviaBosnia and HerzegovinaBrazilBulgariaBurma/MyanmarCabo VerdeCambodiaCameroonCanadaCaribbeanCentral AmericaChileChinaColombiaCongoCosta RicaCroatiaCubaCzechoslovakiaDenmarkDominicaDominican RepublicEastern AfricaEastern AsiaEastern EuropeEcuadorEgyptEl SalvadorEnglandEritreaEthiopiaEuropeFijiFranceGermanyGhanaGreeceGrenadaGuatemalaGuyanaHaitiHondurasHong KongHungaryIndiaIndonesiaIranIraqIrelandIsraelItalyJamaicaJapanJordanKazakhstanKenyaKoreaKuwaitLaosLatin AmericaLatviaLebanonLiberiaLithuaniaMalaysiaMexicoMicronesiaMiddle AfricaMoldovaMoroccoNepalNetherlandsNicaraguaNigeriaNorth AmericaNorth MacedoniaNorthern AfricaNorthern EuropeNorwayOceaniaPakistanPanamaPeruPhilippinesPolandPortugalRomaniaRussiaScotlandSenegalSerbiaSierra LeoneSingaporeSomaliaSouth AfricaSouth AmericaSouth Central AsiaSouth Eastern AsiaSouthern EuropeSpainSri LankaSt. Vincent and the GrenadinesSudanSwedenSwitzerlandSyriaTaiwanThailandTrinidad and TobagoTurkeyUgandaUkraineUruguayUzbekistanVenezuelaVietnamWest IndiesWestern AfricaWestern AsiaWestern EuropeYemenZaireZimbabweAzores
Female Poverty Among 25-34 Year Olds
Income
Poverty
Unemployment
Labor Participation
Family Structure
Vehicle Availability
Education Level
Disability

Female Poverty Among 25-34 Year Olds Comparison

Immigrants from Saudi Arabia

Ghanaians

Fair
Tragic
13.9%
FEMALE POVERTY AMONG 25-34 YEAR OLDS
21.9/ 100
METRIC RATING
197th/ 347
METRIC RANK
14.4%
FEMALE POVERTY AMONG 25-34 YEAR OLDS
4.8/ 100
METRIC RATING
220th/ 347
METRIC RANK

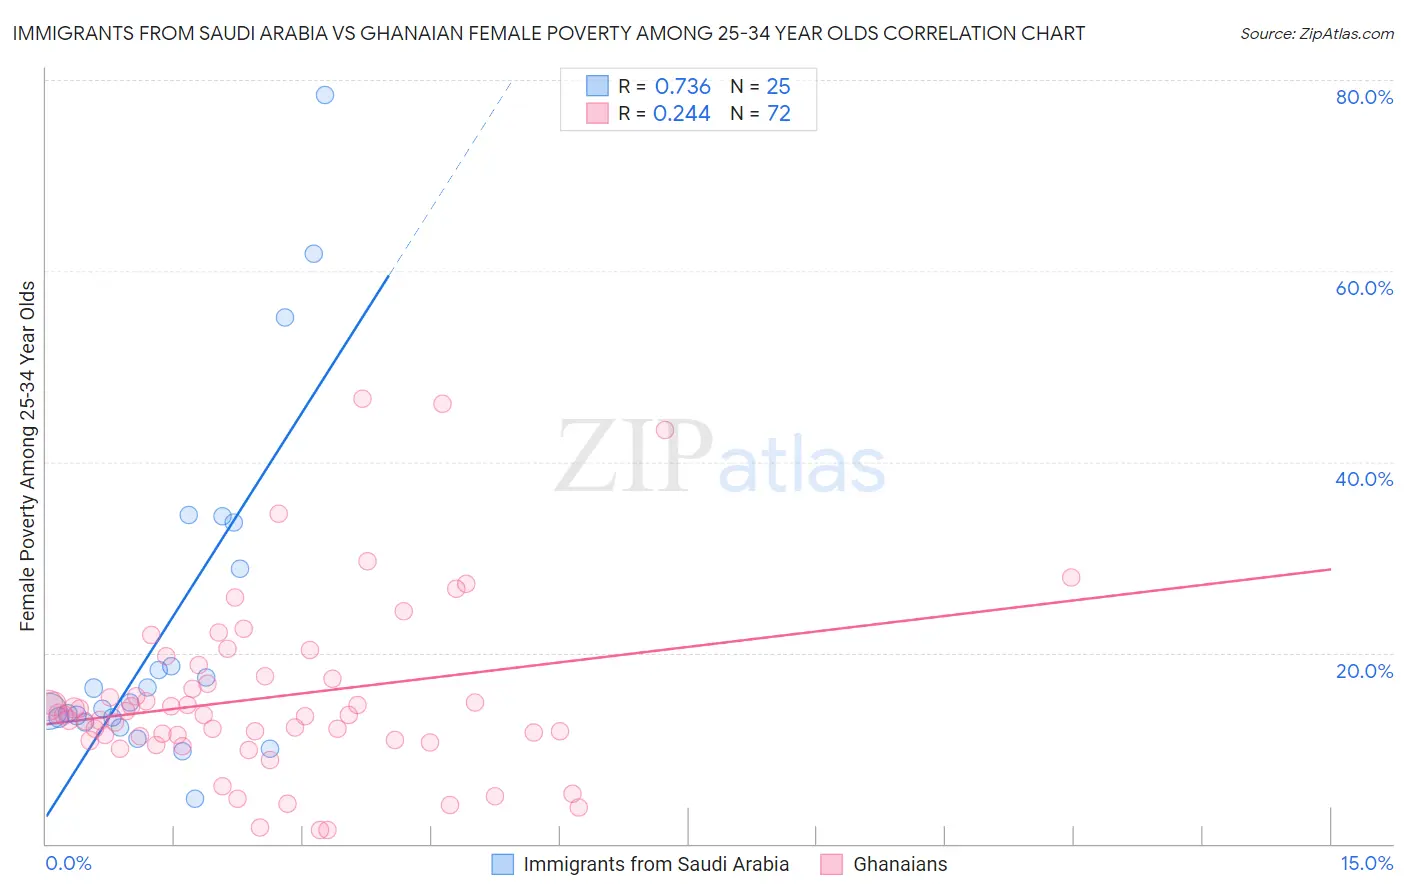
Immigrants from Saudi Arabia vs Ghanaian Female Poverty Among 25-34 Year Olds Correlation Chart

The statistical analysis conducted on geographies consisting of 163,611,416 people shows a strong positive correlation between the proportion of Immigrants from Saudi Arabia and poverty level among females between the ages 25 and 34 in the United States with a correlation coefficient (R) of 0.736 and weighted average of 13.9%. Similarly, the statistical analysis conducted on geographies consisting of 189,437,632 people shows a weak positive correlation between the proportion of Ghanaians and poverty level among females between the ages 25 and 34 in the United States with a correlation coefficient (R) of 0.244 and weighted average of 14.4%, a difference of 3.5%.
Immigrants from Saudi Arabia vs Ghanaian Female Poverty Among 25-34 Year Olds

Female Poverty Among 25-34 Year Olds Correlation Summary

MeasurementImmigrants from Saudi ArabiaGhanaian
Minimum4.7%1.4%
Maximum78.4%46.7%
Range73.6%45.2%
Mean22.8%15.3%
Median14.8%13.5%
Interquartile 25% (IQ1)13.0%11.1%
Interquartile 75% (IQ3)31.3%17.4%
Interquartile Range (IQR)18.3%6.3%
Standard Deviation (Sample)18.1%9.1%
Standard Deviation (Population)17.7%9.1%

Similar Demographics by Female Poverty Among 25-34 Year Olds

Demographics Similar to Immigrants from Saudi Arabia by Female Poverty Among 25-34 Year Olds

In terms of female poverty among 25-34 year olds, the demographic groups most similar to Immigrants from Saudi Arabia are Immigrants from Germany (13.9%, a difference of 0.11%), English (13.9%, a difference of 0.18%), Hmong (13.9%, a difference of 0.19%), Scottish (13.9%, a difference of 0.20%), and Immigrants from Cambodia (13.9%, a difference of 0.25%).
DemographicsRating | RankFemale Poverty Among 25-34 Year Olds
Dutch
29.7
/100
|
#190
Fair
13.8%
Immigrants | St. Vincent and the Grenadines
29.3
/100
|
#191
Fair
13.8%
Tlingit-Haida
28.1
/100
|
#192
Fair
13.8%
Immigrants | Kenya
28.0
/100
|
#193
Fair
13.8%
Moroccans
25.1
/100
|
#194
Fair
13.8%
Immigrants | Cambodia
24.0
/100
|
#195
Fair
13.9%
Scottish
23.6
/100
|
#196
Fair
13.9%
Immigrants | Saudi Arabia
21.9
/100
|
#197
Fair
13.9%
Immigrants | Germany
20.9
/100
|
#198
Fair
13.9%
English
20.4
/100
|
#199
Fair
13.9%
Hmong
20.3
/100
|
#200
Fair
13.9%
Immigrants | Trinidad and Tobago
17.6
/100
|
#201
Poor
14.0%
Welsh
17.2
/100
|
#202
Poor
14.0%
Immigrants | Immigrants
14.5
/100
|
#203
Poor
14.0%
Hawaiians
13.6
/100
|
#204
Poor
14.1%

Demographics Similar to Ghanaians by Female Poverty Among 25-34 Year Olds

In terms of female poverty among 25-34 year olds, the demographic groups most similar to Ghanaians are Sudanese (14.4%, a difference of 0.15%), Ecuadorian (14.3%, a difference of 0.16%), Immigrants from Thailand (14.3%, a difference of 0.17%), Immigrants from Portugal (14.4%, a difference of 0.22%), and French Canadian (14.3%, a difference of 0.28%).
DemographicsRating | RankFemale Poverty Among 25-34 Year Olds
Puget Sound Salish
6.5
/100
|
#213
Tragic
14.3%
French
6.2
/100
|
#214
Tragic
14.3%
Immigrants | Nigeria
6.2
/100
|
#215
Tragic
14.3%
French Canadians
5.5
/100
|
#216
Tragic
14.3%
Spanish American Indians
5.5
/100
|
#217
Tragic
14.3%
Immigrants | Thailand
5.2
/100
|
#218
Tragic
14.3%
Ecuadorians
5.2
/100
|
#219
Tragic
14.3%
Ghanaians
4.8
/100
|
#220
Tragic
14.4%
Sudanese
4.4
/100
|
#221
Tragic
14.4%
Immigrants | Portugal
4.3
/100
|
#222
Tragic
14.4%
Nigerians
4.2
/100
|
#223
Tragic
14.4%
Immigrants | Sudan
4.0
/100
|
#224
Tragic
14.4%
Immigrants | Barbados
3.4
/100
|
#225
Tragic
14.5%
Nicaraguans
3.3
/100
|
#226
Tragic
14.5%
Celtics
2.8
/100
|
#227
Tragic
14.5%