Immigrants from Russia vs American Single Mother Poverty

COMPARE

Immigrants from Russia
Race
Ancestry
AfghanAfricanAlaska NativeAlaskan AthabascanAlbanianAleutAlsatianApacheArabArapahoArgentineanArmenianAssyrian/Chaldean/SyriacAustralianAustrianBahamianBangladeshiBarbadianBasqueBelgianBelizeanBermudanBhutaneseBlackfeetBolivianBrazilianBritishBritish West IndianBulgarianBurmeseCajunCambodianCanadianCape VerdeanCarpatho RusynCelticCentral AmericanCentral American IndianCherokeeCheyenneChickasawChileanChineseChippewaChoctawColombianColvilleComancheCosta RicanCreeCreekCroatianCrowCubanCypriotCzechCzechoslovakianDanishDelawareDominicanDutchDutch West IndianEastern EuropeanEcuadorianEgyptianEnglishEstonianEthiopianEuropeanFijianFilipinoFinnishFrenchFrench American IndianFrench CanadianGermanGerman RussianGhanaianGreekGuamanian/ChamorroGuatemalanGuyaneseHaitianHmongHonduranHopiHoumaHungarianIcelanderIndian (Asian)IndonesianInupiatIranianIraqiIrishIroquoisIsraeliItalianJamaicanJapaneseJordanianKenyanKiowaKoreanLaotianLatvianLebaneseLiberianLithuanianLumbeeLuxembourgerMacedonianMalaysianMalteseMarshalleseMenomineeMexicanMexican American IndianMongolianMoroccanNative HawaiianNavajoNepaleseNew ZealanderNicaraguanNigerianNorthern EuropeanNorwegianOkinawanOsageOttawaPaiutePakistaniPalestinianPanamanianParaguayanPennsylvania GermanPeruvianPimaPolishPortuguesePotawatomiPuebloPuerto RicanPuget Sound SalishRomanianRussianSalvadoranSamoanScandinavianScotch-IrishScottishSeminoleSenegaleseSerbianShoshoneSierra LeoneanSiouxSlavicSlovakSloveneSomaliSouth AfricanSouth AmericanSouth American IndianSoviet UnionSpaniardSpanishSpanish AmericanSpanish American IndianSri LankanSubsaharan AfricanSudaneseSwedishSwissSyrianTaiwaneseThaiTlingit-HaidaTohono O'OdhamTonganTrinidadian and TobagonianTsimshianTurkishU.S. Virgin IslanderUgandanUkrainianUruguayanUteVenezuelanVietnameseWelshWest IndianYakamaYaquiYugoslavianYumanYup'ikZimbabwean
Immigration
NonimmigrantsImmigrantsAfghanistanAfricaAlbaniaArgentinaArmeniaAsiaAustraliaAustriaBahamasBangladeshBarbadosBelarusBelgiumBelizeBoliviaBosnia and HerzegovinaBrazilBulgariaBurma/MyanmarCabo VerdeCambodiaCameroonCanadaCaribbeanCentral AmericaChileChinaColombiaCongoCosta RicaCroatiaCubaCzechoslovakiaDenmarkDominicaDominican RepublicEastern AfricaEastern AsiaEastern EuropeEcuadorEgyptEl SalvadorEnglandEritreaEthiopiaEuropeFijiFranceGermanyGhanaGreeceGrenadaGuatemalaGuyanaHaitiHondurasHong KongHungaryIndiaIndonesiaIranIraqIrelandIsraelItalyJamaicaJapanJordanKazakhstanKenyaKoreaKuwaitLaosLatin AmericaLatviaLebanonLiberiaLithuaniaMalaysiaMexicoMicronesiaMiddle AfricaMoldovaMoroccoNepalNetherlandsNicaraguaNigeriaNorth AmericaNorth MacedoniaNorthern AfricaNorthern EuropeNorwayOceaniaPakistanPanamaPeruPhilippinesPolandPortugalRomaniaRussiaSaudi ArabiaScotlandSenegalSerbiaSierra LeoneSingaporeSomaliaSouth AfricaSouth AmericaSouth Central AsiaSouth Eastern AsiaSouthern EuropeSpainSri LankaSt. Vincent and the GrenadinesSudanSwedenSwitzerlandSyriaTaiwanThailandTrinidad and TobagoTurkeyUgandaUkraineUruguayUzbekistanVenezuelaVietnamWest IndiesWestern AfricaWestern AsiaWestern EuropeYemenZaireZimbabweAzores
American
Race
Ancestry
AfghanAfricanAlaska NativeAlaskan AthabascanAlbanianAleutAlsatianAmericanApacheArabArapahoArgentineanArmenianAssyrian/Chaldean/SyriacAustralianAustrianBahamianBangladeshiBarbadianBasqueBelgianBelizeanBermudanBhutaneseBlackfeetBolivianBrazilianBritishBritish West IndianBulgarianBurmeseCajunCambodianCanadianCape VerdeanCarpatho RusynCelticCentral AmericanCentral American IndianCherokeeCheyenneChickasawChileanChineseChippewaChoctawColombianColvilleComancheCosta RicanCreeCreekCroatianCrowCubanCypriotCzechCzechoslovakianDanishDelawareDominicanDutchDutch West IndianEastern EuropeanEcuadorianEgyptianEnglishEstonianEthiopianEuropeanFijianFilipinoFinnishFrenchFrench American IndianFrench CanadianGermanGerman RussianGhanaianGreekGuamanian/ChamorroGuatemalanGuyaneseHaitianHmongHonduranHopiHoumaHungarianIcelanderIndian (Asian)IndonesianInupiatIranianIraqiIrishIroquoisIsraeliItalianJamaicanJapaneseJordanianKenyanKiowaKoreanLaotianLatvianLebaneseLiberianLithuanianLumbeeLuxembourgerMacedonianMalaysianMalteseMarshalleseMenomineeMexicanMexican American IndianMongolianMoroccanNative HawaiianNavajoNepaleseNew ZealanderNicaraguanNigerianNorthern EuropeanNorwegianOkinawanOsageOttawaPaiutePakistaniPalestinianPanamanianParaguayanPennsylvania GermanPeruvianPimaPolishPortuguesePotawatomiPuebloPuerto RicanPuget Sound SalishRomanianRussianSalvadoranSamoanScandinavianScotch-IrishScottishSeminoleSenegaleseSerbianShoshoneSierra LeoneanSiouxSlavicSlovakSloveneSomaliSouth AfricanSouth AmericanSouth American IndianSoviet UnionSpaniardSpanishSpanish AmericanSpanish American IndianSri LankanSubsaharan AfricanSudaneseSwedishSwissSyrianTaiwaneseThaiTlingit-HaidaTohono O'OdhamTonganTrinidadian and TobagonianTsimshianTurkishU.S. Virgin IslanderUgandanUkrainianUruguayanUteVenezuelanVietnameseWelshWest IndianYakamaYaquiYugoslavianYumanYup'ikZimbabwean
Immigration
NonimmigrantsImmigrantsAfghanistanAfricaAlbaniaArgentinaArmeniaAsiaAustraliaAustriaBahamasBangladeshBarbadosBelarusBelgiumBelizeBoliviaBosnia and HerzegovinaBrazilBulgariaBurma/MyanmarCabo VerdeCambodiaCameroonCanadaCaribbeanCentral AmericaChileChinaColombiaCongoCosta RicaCroatiaCubaCzechoslovakiaDenmarkDominicaDominican RepublicEastern AfricaEastern AsiaEastern EuropeEcuadorEgyptEl SalvadorEnglandEritreaEthiopiaEuropeFijiFranceGermanyGhanaGreeceGrenadaGuatemalaGuyanaHaitiHondurasHong KongHungaryIndiaIndonesiaIranIraqIrelandIsraelItalyJamaicaJapanJordanKazakhstanKenyaKoreaKuwaitLaosLatin AmericaLatviaLebanonLiberiaLithuaniaMalaysiaMexicoMicronesiaMiddle AfricaMoldovaMoroccoNepalNetherlandsNicaraguaNigeriaNorth AmericaNorth MacedoniaNorthern AfricaNorthern EuropeNorwayOceaniaPakistanPanamaPeruPhilippinesPolandPortugalRomaniaSaudi ArabiaScotlandSenegalSerbiaSierra LeoneSingaporeSomaliaSouth AfricaSouth AmericaSouth Central AsiaSouth Eastern AsiaSouthern EuropeSpainSri LankaSt. Vincent and the GrenadinesSudanSwedenSwitzerlandSyriaTaiwanThailandTrinidad and TobagoTurkeyUgandaUkraineUruguayUzbekistanVenezuelaVietnamWest IndiesWestern AfricaWestern AsiaWestern EuropeYemenZaireZimbabweAzores
Single Mother Poverty
Income
Poverty
Unemployment
Labor Participation
Family Structure
Vehicle Availability
Education Level
Disability

Single Mother Poverty Comparison

Immigrants from Russia

Americans

Exceptional
Tragic
27.4%
SINGLE MOTHER POVERTY
99.4/ 100
METRIC RATING
72nd/ 347
METRIC RANK
33.5%
SINGLE MOTHER POVERTY
0.0/ 100
METRIC RATING
303rd/ 347
METRIC RANK

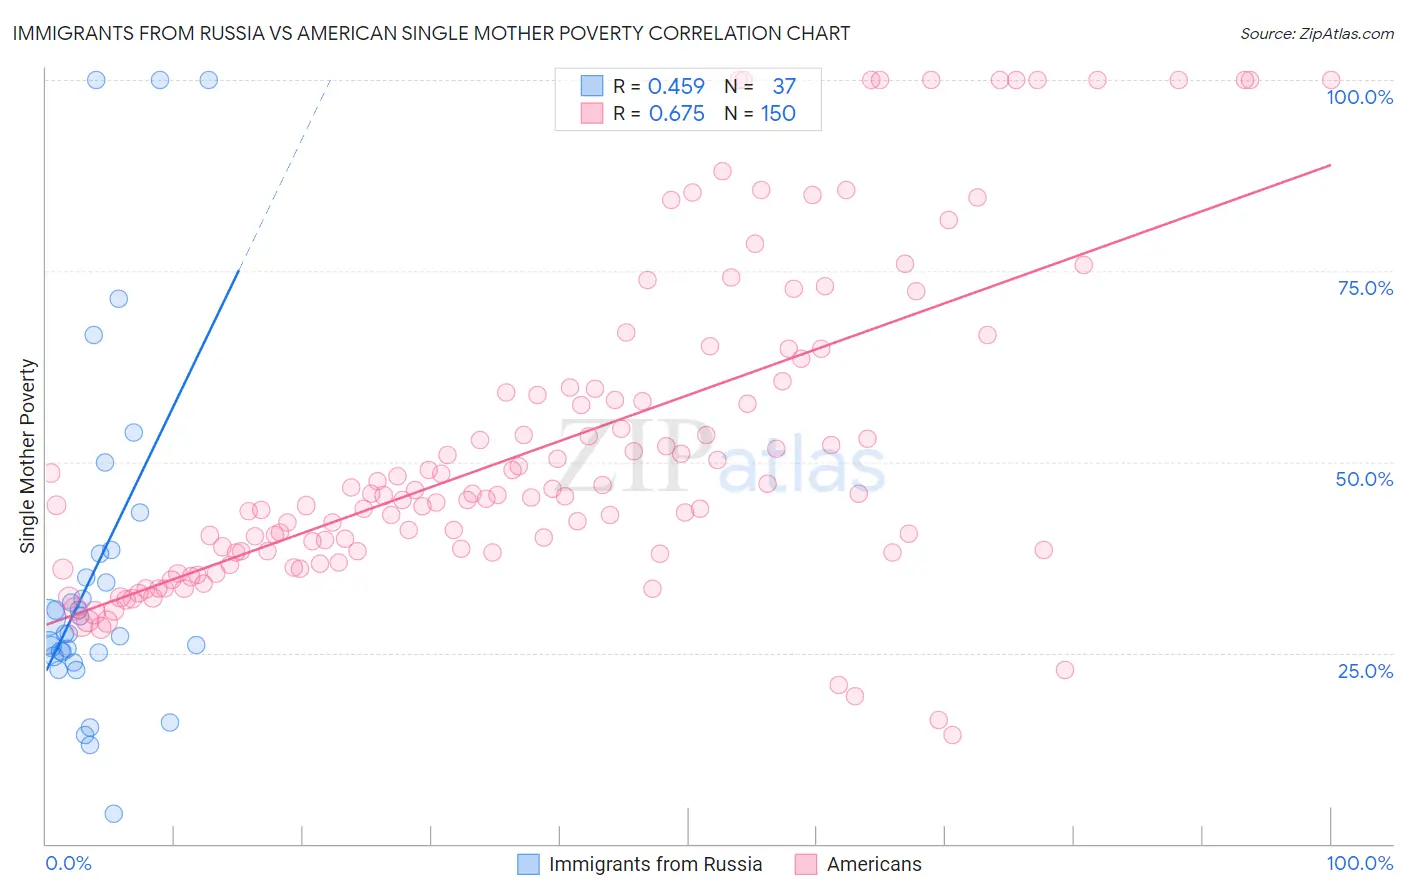
Immigrants from Russia vs American Single Mother Poverty Correlation Chart

The statistical analysis conducted on geographies consisting of 339,121,239 people shows a moderate positive correlation between the proportion of Immigrants from Russia and poverty level among single mothers in the United States with a correlation coefficient (R) of 0.459 and weighted average of 27.4%. Similarly, the statistical analysis conducted on geographies consisting of 551,658,648 people shows a significant positive correlation between the proportion of Americans and poverty level among single mothers in the United States with a correlation coefficient (R) of 0.675 and weighted average of 33.5%, a difference of 22.3%.
Immigrants from Russia vs American Single Mother Poverty

Single Mother Poverty Correlation Summary

MeasurementImmigrants from RussiaAmerican
Minimum3.9%14.3%
Maximum100.0%100.0%
Range96.1%85.7%
Mean36.0%51.9%
Median27.5%45.5%
Interquartile 25% (IQ1)24.8%38.2%
Interquartile 75% (IQ3)38.2%59.6%
Interquartile Range (IQR)13.4%21.5%
Standard Deviation (Sample)23.4%21.0%
Standard Deviation (Population)23.1%20.9%

Similar Demographics by Single Mother Poverty

Demographics Similar to Immigrants from Russia by Single Mother Poverty

In terms of single mother poverty, the demographic groups most similar to Immigrants from Russia are Macedonian (27.4%, a difference of 0.020%), Immigrants from Belarus (27.4%, a difference of 0.040%), Lithuanian (27.4%, a difference of 0.060%), Sierra Leonean (27.4%, a difference of 0.060%), and Immigrants from Europe (27.4%, a difference of 0.13%).
DemographicsRating | RankSingle Mother Poverty
Immigrants | Turkey
99.5
/100
|
#65
Exceptional
27.3%
Soviet Union
99.5
/100
|
#66
Exceptional
27.3%
Immigrants | Australia
99.5
/100
|
#67
Exceptional
27.3%
Immigrants | Czechoslovakia
99.5
/100
|
#68
Exceptional
27.4%
Lithuanians
99.4
/100
|
#69
Exceptional
27.4%
Immigrants | Belarus
99.4
/100
|
#70
Exceptional
27.4%
Macedonians
99.4
/100
|
#71
Exceptional
27.4%
Immigrants | Russia
99.4
/100
|
#72
Exceptional
27.4%
Sierra Leoneans
99.3
/100
|
#73
Exceptional
27.4%
Immigrants | Europe
99.3
/100
|
#74
Exceptional
27.4%
Immigrants | Sweden
99.2
/100
|
#75
Exceptional
27.5%
Peruvians
99.2
/100
|
#76
Exceptional
27.5%
Immigrants | Peru
99.2
/100
|
#77
Exceptional
27.5%
Immigrants | North Macedonia
99.2
/100
|
#78
Exceptional
27.5%
Immigrants | Italy
99.1
/100
|
#79
Exceptional
27.5%

Demographics Similar to Americans by Single Mother Poverty

In terms of single mother poverty, the demographic groups most similar to Americans are Mexican (33.6%, a difference of 0.10%), Immigrants from Central America (33.6%, a difference of 0.15%), Arapaho (33.4%, a difference of 0.26%), Immigrants from Somalia (33.4%, a difference of 0.41%), and Immigrants from Guatemala (33.3%, a difference of 0.65%).
DemographicsRating | RankSingle Mother Poverty
Blackfeet
0.0
/100
|
#296
Tragic
33.2%
Pennsylvania Germans
0.0
/100
|
#297
Tragic
33.2%
Africans
0.0
/100
|
#298
Tragic
33.3%
Immigrants | Guatemala
0.0
/100
|
#299
Tragic
33.3%
Hispanics or Latinos
0.0
/100
|
#300
Tragic
33.3%
Immigrants | Somalia
0.0
/100
|
#301
Tragic
33.4%
Arapaho
0.0
/100
|
#302
Tragic
33.4%
Americans
0.0
/100
|
#303
Tragic
33.5%
Mexicans
0.0
/100
|
#304
Tragic
33.6%
Immigrants | Central America
0.0
/100
|
#305
Tragic
33.6%
Immigrants | Congo
0.0
/100
|
#306
Tragic
33.8%
Comanche
0.0
/100
|
#307
Tragic
33.9%
Immigrants | Mexico
0.0
/100
|
#308
Tragic
34.0%
Potawatomi
0.0
/100
|
#309
Tragic
34.1%
Hondurans
0.0
/100
|
#310
Tragic
34.2%