Immigrants from Poland vs Asian Male Poverty
COMPARE
Immigrants from Poland
Asian
Male Poverty
Male Poverty Comparison
Immigrants from Poland
Asians
9.8%
MALE POVERTY
99.5/ 100
METRIC RATING
34th/ 347
METRIC RANK
10.0%
MALE POVERTY
98.7/ 100
METRIC RATING
52nd/ 347
METRIC RANK
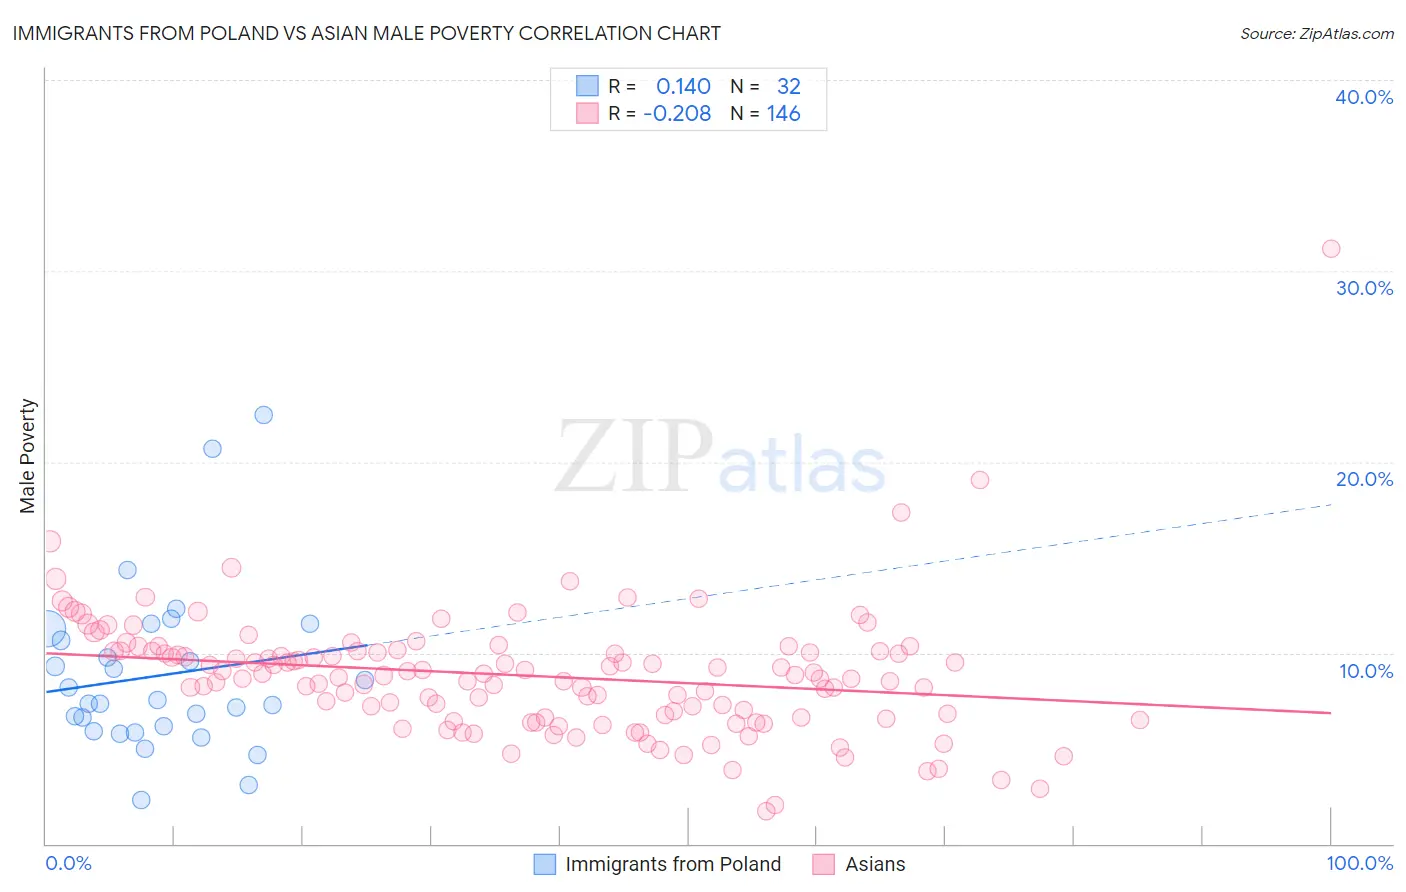
Immigrants from Poland vs Asian Male Poverty Correlation Chart
The statistical analysis conducted on geographies consisting of 304,660,101 people shows a poor positive correlation between the proportion of Immigrants from Poland and poverty level among males in the United States with a correlation coefficient (R) of 0.140 and weighted average of 9.8%. Similarly, the statistical analysis conducted on geographies consisting of 549,643,011 people shows a weak negative correlation between the proportion of Asians and poverty level among males in the United States with a correlation coefficient (R) of -0.208 and weighted average of 10.0%, a difference of 2.6%.
Male Poverty Correlation Summary
| Measurement | Immigrants from Poland | Asian |
| Minimum | 2.3% | 1.7% |
| Maximum | 22.5% | 31.2% |
| Range | 20.2% | 29.4% |
| Mean | 8.8% | 8.8% |
| Median | 7.5% | 8.8% |
| Interquartile 25% (IQ1) | 6.0% | 6.6% |
| Interquartile 75% (IQ3) | 11.0% | 10.1% |
| Interquartile Range (IQR) | 4.9% | 3.5% |
| Standard Deviation (Sample) | 4.3% | 3.3% |
| Standard Deviation (Population) | 4.3% | 3.3% |
Demographics Similar to Immigrants from Poland and Asians by Male Poverty
In terms of male poverty, the demographic groups most similar to Immigrants from Poland are Immigrants from Northern Europe (9.7%, a difference of 0.15%), Iranian (9.8%, a difference of 0.30%), Czech (9.8%, a difference of 0.39%), Immigrants from Greece (9.8%, a difference of 0.62%), and Immigrants from Pakistan (9.9%, a difference of 0.99%). Similarly, the demographic groups most similar to Asians are Immigrants from Czechoslovakia (10.0%, a difference of 0.070%), Immigrants from Croatia (10.0%, a difference of 0.090%), Immigrants from Philippines (10.0%, a difference of 0.19%), Slovene (10.0%, a difference of 0.24%), and Immigrants from Singapore (10.0%, a difference of 0.34%).
| Demographics | Rating | Rank | Male Poverty |
| Immigrants | Northern Europe | 99.5 /100 | #33 | Exceptional 9.7% |
| Immigrants | Poland | 99.5 /100 | #34 | Exceptional 9.8% |
| Iranians | 99.4 /100 | #35 | Exceptional 9.8% |
| Czechs | 99.4 /100 | #36 | Exceptional 9.8% |
| Immigrants | Greece | 99.3 /100 | #37 | Exceptional 9.8% |
| Immigrants | Pakistan | 99.2 /100 | #38 | Exceptional 9.9% |
| Russians | 99.2 /100 | #39 | Exceptional 9.9% |
| Cypriots | 99.2 /100 | #40 | Exceptional 9.9% |
| Koreans | 99.2 /100 | #41 | Exceptional 9.9% |
| Immigrants | Iran | 99.1 /100 | #42 | Exceptional 9.9% |
| Immigrants | Moldova | 99.0 /100 | #43 | Exceptional 9.9% |
| Immigrants | Romania | 98.9 /100 | #44 | Exceptional 9.9% |
| Immigrants | Serbia | 98.9 /100 | #45 | Exceptional 10.0% |
| Turks | 98.9 /100 | #46 | Exceptional 10.0% |
| Immigrants | Singapore | 98.8 /100 | #47 | Exceptional 10.0% |
| Immigrants | Japan | 98.8 /100 | #48 | Exceptional 10.0% |
| Slovenes | 98.8 /100 | #49 | Exceptional 10.0% |
| Immigrants | Philippines | 98.7 /100 | #50 | Exceptional 10.0% |
| Immigrants | Croatia | 98.7 /100 | #51 | Exceptional 10.0% |
| Asians | 98.7 /100 | #52 | Exceptional 10.0% |
| Immigrants | Czechoslovakia | 98.6 /100 | #53 | Exceptional 10.0% |