Immigrants from Peru vs Immigrants from Malaysia Female Poverty Among 18-24 Year Olds

COMPARE

Immigrants from Peru
Race
Ancestry
AfghanAfricanAlaska NativeAlaskan AthabascanAlbanianAleutAlsatianAmericanApacheArabArapahoArgentineanArmenianAssyrian/Chaldean/SyriacAustralianAustrianBahamianBangladeshiBarbadianBasqueBelgianBelizeanBermudanBhutaneseBlackfeetBolivianBrazilianBritishBritish West IndianBulgarianBurmeseCajunCambodianCanadianCape VerdeanCarpatho RusynCelticCentral AmericanCentral American IndianCherokeeCheyenneChickasawChileanChineseChippewaChoctawColombianColvilleComancheCosta RicanCreeCreekCroatianCrowCubanCypriotCzechCzechoslovakianDanishDelawareDominicanDutchDutch West IndianEastern EuropeanEcuadorianEgyptianEnglishEstonianEthiopianEuropeanFijianFilipinoFinnishFrenchFrench American IndianFrench CanadianGermanGerman RussianGhanaianGreekGuamanian/ChamorroGuatemalanGuyaneseHaitianHmongHonduranHopiHoumaHungarianIcelanderIndian (Asian)IndonesianInupiatIranianIraqiIrishIroquoisIsraeliItalianJamaicanJapaneseJordanianKenyanKiowaKoreanLaotianLatvianLebaneseLiberianLithuanianLumbeeLuxembourgerMacedonianMalaysianMalteseMarshalleseMenomineeMexicanMexican American IndianMongolianMoroccanNative HawaiianNavajoNepaleseNew ZealanderNicaraguanNigerianNorthern EuropeanNorwegianOkinawanOsageOttawaPaiutePakistaniPalestinianPanamanianParaguayanPennsylvania GermanPeruvianPimaPolishPortuguesePotawatomiPuebloPuerto RicanPuget Sound SalishRomanianRussianSalvadoranSamoanScandinavianScotch-IrishScottishSeminoleSenegaleseSerbianShoshoneSierra LeoneanSiouxSlavicSlovakSloveneSomaliSouth AfricanSouth AmericanSouth American IndianSoviet UnionSpaniardSpanishSpanish AmericanSpanish American IndianSri LankanSubsaharan AfricanSudaneseSwedishSwissSyrianTaiwaneseThaiTlingit-HaidaTohono O'OdhamTonganTrinidadian and TobagonianTsimshianTurkishU.S. Virgin IslanderUgandanUkrainianUruguayanUteVenezuelanVietnameseWelshWest IndianYakamaYaquiYugoslavianYumanYup'ikZimbabwean
Immigration
NonimmigrantsImmigrantsAfghanistanAfricaAlbaniaArgentinaArmeniaAsiaAustraliaAustriaBahamasBangladeshBarbadosBelarusBelgiumBelizeBoliviaBosnia and HerzegovinaBrazilBulgariaBurma/MyanmarCabo VerdeCambodiaCameroonCanadaCaribbeanCentral AmericaChileChinaColombiaCongoCosta RicaCroatiaCubaCzechoslovakiaDenmarkDominicaDominican RepublicEastern AfricaEastern AsiaEastern EuropeEcuadorEgyptEl SalvadorEnglandEritreaEthiopiaEuropeFijiFranceGermanyGhanaGreeceGrenadaGuatemalaGuyanaHaitiHondurasHong KongHungaryIndiaIndonesiaIranIraqIrelandIsraelItalyJamaicaJapanJordanKazakhstanKenyaKoreaKuwaitLaosLatin AmericaLatviaLebanonLiberiaLithuaniaMexicoMicronesiaMiddle AfricaMoldovaMoroccoNepalNetherlandsNicaraguaNigeriaNorth AmericaNorth MacedoniaNorthern AfricaNorthern EuropeNorwayOceaniaPakistanPanamaPeruPhilippinesPolandPortugalRomaniaRussiaSaudi ArabiaScotlandSenegalSerbiaSierra LeoneSingaporeSomaliaSouth AfricaSouth AmericaSouth Central AsiaSouth Eastern AsiaSouthern EuropeSpainSri LankaSt. Vincent and the GrenadinesSudanSwedenSwitzerlandSyriaTaiwanThailandTrinidad and TobagoTurkeyUgandaUkraineUruguayUzbekistanVenezuelaVietnamWest IndiesWestern AfricaWestern AsiaWestern EuropeYemenZaireZimbabweAzores
Immigrants from Malaysia
Race
Ancestry
AfghanAfricanAlaska NativeAlaskan AthabascanAlbanianAleutAlsatianAmericanApacheArabArapahoArgentineanArmenianAssyrian/Chaldean/SyriacAustralianAustrianBahamianBangladeshiBarbadianBasqueBelgianBelizeanBermudanBhutaneseBlackfeetBolivianBrazilianBritishBritish West IndianBulgarianBurmeseCajunCambodianCanadianCape VerdeanCarpatho RusynCelticCentral AmericanCentral American IndianCherokeeCheyenneChickasawChileanChineseChippewaChoctawColombianColvilleComancheCosta RicanCreeCreekCroatianCrowCubanCypriotCzechCzechoslovakianDanishDelawareDominicanDutchDutch West IndianEastern EuropeanEcuadorianEgyptianEnglishEstonianEthiopianEuropeanFijianFilipinoFinnishFrenchFrench American IndianFrench CanadianGermanGerman RussianGhanaianGreekGuamanian/ChamorroGuatemalanGuyaneseHaitianHmongHonduranHopiHoumaHungarianIcelanderIndian (Asian)IndonesianInupiatIranianIraqiIrishIroquoisIsraeliItalianJamaicanJapaneseJordanianKenyanKiowaKoreanLaotianLatvianLebaneseLiberianLithuanianLumbeeLuxembourgerMacedonianMalaysianMalteseMarshalleseMenomineeMexicanMexican American IndianMongolianMoroccanNative HawaiianNavajoNepaleseNew ZealanderNicaraguanNigerianNorthern EuropeanNorwegianOkinawanOsageOttawaPaiutePakistaniPalestinianPanamanianParaguayanPennsylvania GermanPeruvianPimaPolishPortuguesePotawatomiPuebloPuerto RicanPuget Sound SalishRomanianRussianSalvadoranSamoanScandinavianScotch-IrishScottishSeminoleSenegaleseSerbianShoshoneSierra LeoneanSiouxSlavicSlovakSloveneSomaliSouth AfricanSouth AmericanSouth American IndianSoviet UnionSpaniardSpanishSpanish AmericanSpanish American IndianSri LankanSubsaharan AfricanSudaneseSwedishSwissSyrianTaiwaneseThaiTlingit-HaidaTohono O'OdhamTonganTrinidadian and TobagonianTsimshianTurkishU.S. Virgin IslanderUgandanUkrainianUruguayanUteVenezuelanVietnameseWelshWest IndianYakamaYaquiYugoslavianYumanYup'ikZimbabwean
Immigration
NonimmigrantsImmigrantsAfghanistanAfricaAlbaniaArgentinaArmeniaAsiaAustraliaAustriaBahamasBangladeshBarbadosBelarusBelgiumBelizeBoliviaBosnia and HerzegovinaBrazilBulgariaBurma/MyanmarCabo VerdeCambodiaCameroonCanadaCaribbeanCentral AmericaChileChinaColombiaCongoCosta RicaCroatiaCubaCzechoslovakiaDenmarkDominicaDominican RepublicEastern AfricaEastern AsiaEastern EuropeEcuadorEgyptEl SalvadorEnglandEritreaEthiopiaEuropeFijiFranceGermanyGhanaGreeceGrenadaGuatemalaGuyanaHaitiHondurasHong KongHungaryIndiaIndonesiaIranIraqIrelandIsraelItalyJamaicaJapanJordanKazakhstanKenyaKoreaKuwaitLaosLatin AmericaLatviaLebanonLiberiaLithuaniaMalaysiaMexicoMicronesiaMiddle AfricaMoldovaMoroccoNepalNetherlandsNicaraguaNigeriaNorth AmericaNorth MacedoniaNorthern AfricaNorthern EuropeNorwayOceaniaPakistanPanamaPhilippinesPolandPortugalRomaniaRussiaSaudi ArabiaScotlandSenegalSerbiaSierra LeoneSingaporeSomaliaSouth AfricaSouth AmericaSouth Central AsiaSouth Eastern AsiaSouthern EuropeSpainSri LankaSt. Vincent and the GrenadinesSudanSwedenSwitzerlandSyriaTaiwanThailandTrinidad and TobagoTurkeyUgandaUkraineUruguayUzbekistanVenezuelaVietnamWest IndiesWestern AfricaWestern AsiaWestern EuropeYemenZaireZimbabweAzores
Female Poverty Among 18-24 Year Olds
Income
Poverty
Unemployment
Labor Participation
Family Structure
Vehicle Availability
Education Level
Disability

Female Poverty Among 18-24 Year Olds Comparison

Immigrants from Peru

Immigrants from Malaysia

Exceptional
Poor
16.9%
FEMALE POVERTY AMONG 18-24 YEAR OLDS
100.0/ 100
METRIC RATING
9th/ 347
METRIC RANK
20.5%
FEMALE POVERTY AMONG 18-24 YEAR OLDS
17.2/ 100
METRIC RATING
203rd/ 347
METRIC RANK

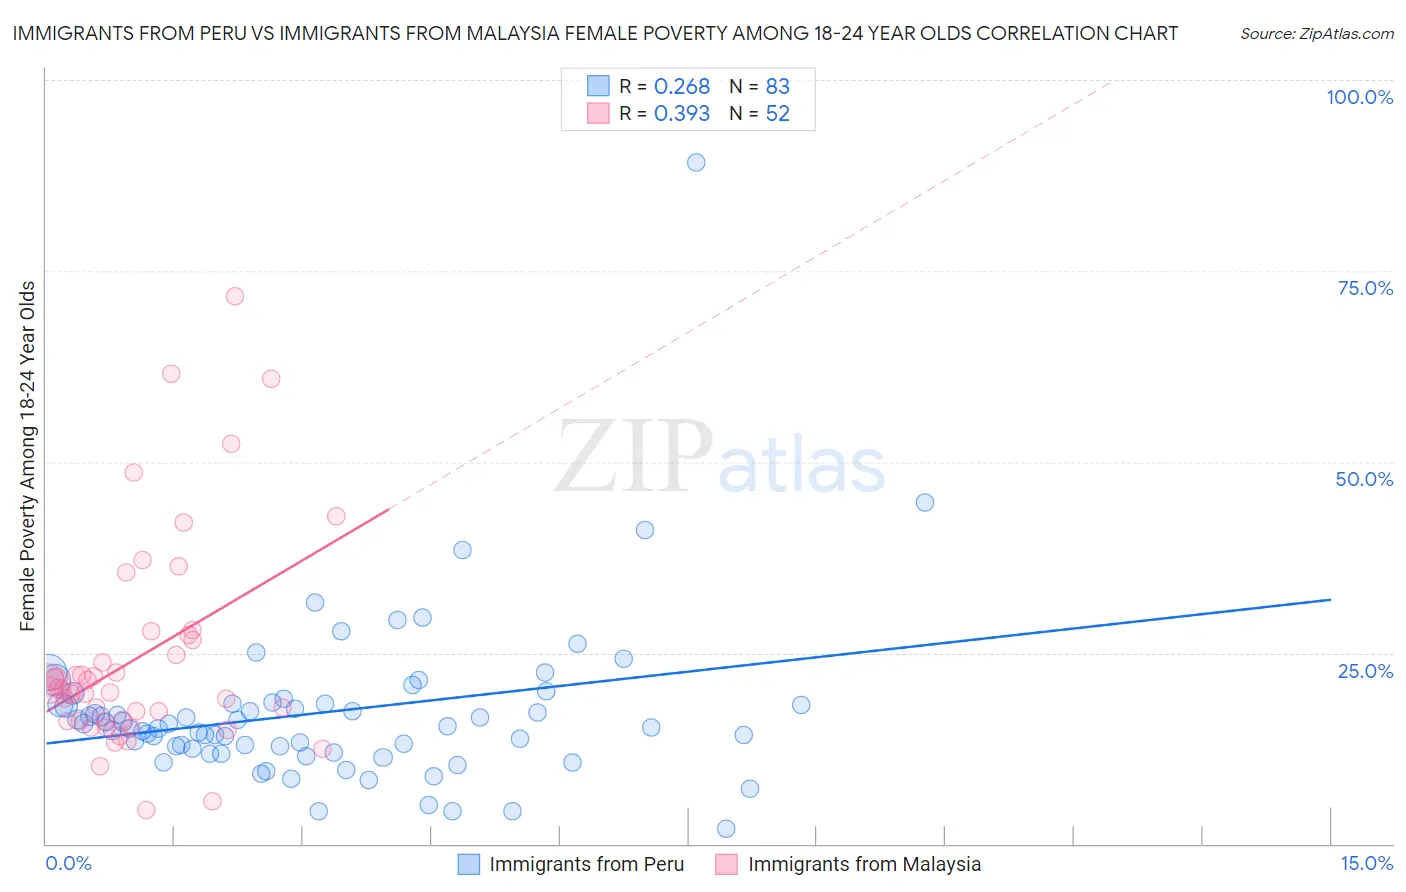
Immigrants from Peru vs Immigrants from Malaysia Female Poverty Among 18-24 Year Olds Correlation Chart

The statistical analysis conducted on geographies consisting of 322,984,963 people shows a weak positive correlation between the proportion of Immigrants from Peru and poverty level among females between the ages 18 and 24 in the United States with a correlation coefficient (R) of 0.268 and weighted average of 16.9%. Similarly, the statistical analysis conducted on geographies consisting of 195,617,735 people shows a mild positive correlation between the proportion of Immigrants from Malaysia and poverty level among females between the ages 18 and 24 in the United States with a correlation coefficient (R) of 0.393 and weighted average of 20.5%, a difference of 21.4%.
Immigrants from Peru vs Immigrants from Malaysia Female Poverty Among 18-24 Year Olds

Female Poverty Among 18-24 Year Olds Correlation Summary

MeasurementImmigrants from PeruImmigrants from Malaysia
Minimum2.0%4.5%
Maximum89.2%71.6%
Range87.2%67.2%
Mean17.2%24.4%
Median15.3%20.1%
Interquartile 25% (IQ1)12.5%16.1%
Interquartile 75% (IQ3)18.4%27.0%
Interquartile Range (IQR)5.9%10.9%
Standard Deviation (Sample)10.9%14.0%
Standard Deviation (Population)10.9%13.8%

Similar Demographics by Female Poverty Among 18-24 Year Olds

Demographics Similar to Immigrants from Peru by Female Poverty Among 18-24 Year Olds

In terms of female poverty among 18-24 year olds, the demographic groups most similar to Immigrants from Peru are Korean (16.9%, a difference of 0.36%), Thai (17.0%, a difference of 0.63%), Immigrants from Pakistan (17.0%, a difference of 0.72%), Immigrants from Bolivia (16.7%, a difference of 0.84%), and Immigrants from the Azores (16.7%, a difference of 1.1%).
DemographicsRating | RankFemale Poverty Among 18-24 Year Olds
Chinese
100.0
/100
|
#2
Exceptional
16.2%
Immigrants | Cuba
100.0
/100
|
#3
Exceptional
16.4%
Immigrants | India
100.0
/100
|
#4
Exceptional
16.4%
Immigrants | Portugal
100.0
/100
|
#5
Exceptional
16.5%
Immigrants | Philippines
100.0
/100
|
#6
Exceptional
16.7%
Immigrants | Azores
100.0
/100
|
#7
Exceptional
16.7%
Immigrants | Bolivia
100.0
/100
|
#8
Exceptional
16.7%
Immigrants | Peru
100.0
/100
|
#9
Exceptional
16.9%
Koreans
100.0
/100
|
#10
Exceptional
16.9%
Thais
100.0
/100
|
#11
Exceptional
17.0%
Immigrants | Pakistan
100.0
/100
|
#12
Exceptional
17.0%
Immigrants | Poland
100.0
/100
|
#13
Exceptional
17.1%
Tongans
100.0
/100
|
#14
Exceptional
17.1%
Cubans
100.0
/100
|
#15
Exceptional
17.2%
Peruvians
100.0
/100
|
#16
Exceptional
17.2%

Demographics Similar to Immigrants from Malaysia by Female Poverty Among 18-24 Year Olds

In terms of female poverty among 18-24 year olds, the demographic groups most similar to Immigrants from Malaysia are Immigrants from Netherlands (20.5%, a difference of 0.020%), Immigrants from Turkey (20.5%, a difference of 0.040%), English (20.5%, a difference of 0.040%), Hispanic or Latino (20.5%, a difference of 0.050%), and Spaniard (20.5%, a difference of 0.070%).
DemographicsRating | RankFemale Poverty Among 18-24 Year Olds
Czechs
22.3
/100
|
#196
Fair
20.4%
Zimbabweans
21.0
/100
|
#197
Fair
20.4%
Immigrants | Spain
20.7
/100
|
#198
Fair
20.4%
Germans
20.6
/100
|
#199
Fair
20.4%
Europeans
19.9
/100
|
#200
Poor
20.4%
Mexicans
18.3
/100
|
#201
Poor
20.5%
Immigrants | Turkey
17.7
/100
|
#202
Poor
20.5%
Immigrants | Malaysia
17.2
/100
|
#203
Poor
20.5%
Immigrants | Netherlands
17.0
/100
|
#204
Poor
20.5%
English
16.7
/100
|
#205
Poor
20.5%
Hispanics or Latinos
16.6
/100
|
#206
Poor
20.5%
Spaniards
16.3
/100
|
#207
Poor
20.5%
Dutch
15.9
/100
|
#208
Poor
20.5%
Arabs
15.5
/100
|
#209
Poor
20.5%
Immigrants | Ghana
14.3
/100
|
#210
Poor
20.5%