Immigrants from Northern Africa vs Spanish Male Poverty
COMPARE
Immigrants from Northern Africa
Spanish
Male Poverty
Male Poverty Comparison
Immigrants from Northern Africa
Spanish
11.1%
MALE POVERTY
59.7/ 100
METRIC RATING
161st/ 347
METRIC RANK
11.7%
MALE POVERTY
14.1/ 100
METRIC RATING
199th/ 347
METRIC RANK
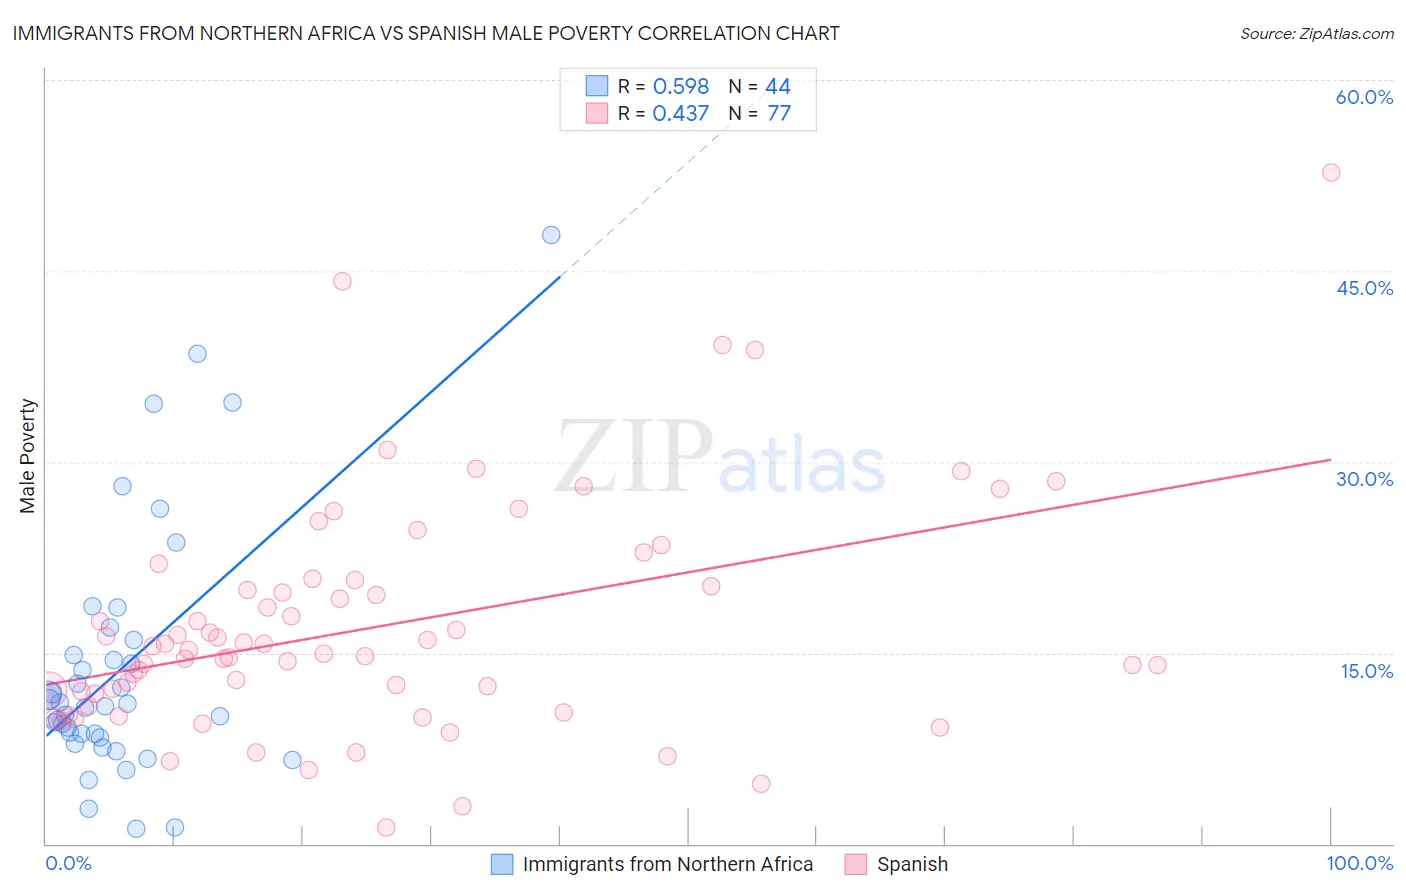
Immigrants from Northern Africa vs Spanish Male Poverty Correlation Chart
The statistical analysis conducted on geographies consisting of 320,989,271 people shows a substantial positive correlation between the proportion of Immigrants from Northern Africa and poverty level among males in the United States with a correlation coefficient (R) of 0.598 and weighted average of 11.1%. Similarly, the statistical analysis conducted on geographies consisting of 421,778,178 people shows a moderate positive correlation between the proportion of Spanish and poverty level among males in the United States with a correlation coefficient (R) of 0.437 and weighted average of 11.7%, a difference of 5.4%.
Male Poverty Correlation Summary
| Measurement | Immigrants from Northern Africa | Spanish |
| Minimum | 1.1% | 1.2% |
| Maximum | 47.8% | 52.7% |
| Range | 46.7% | 51.5% |
| Mean | 13.8% | 17.1% |
| Median | 10.9% | 15.2% |
| Interquartile 25% (IQ1) | 8.5% | 11.3% |
| Interquartile 75% (IQ3) | 15.4% | 20.4% |
| Interquartile Range (IQR) | 6.9% | 9.1% |
| Standard Deviation (Sample) | 9.9% | 9.1% |
| Standard Deviation (Population) | 9.8% | 9.0% |
Similar Demographics by Male Poverty
Demographics Similar to Immigrants from Northern Africa by Male Poverty
In terms of male poverty, the demographic groups most similar to Immigrants from Northern Africa are Soviet Union (11.1%, a difference of 0.070%), Immigrants from Chile (11.1%, a difference of 0.23%), White/Caucasian (11.1%, a difference of 0.30%), Ethiopian (11.1%, a difference of 0.30%), and Taiwanese (11.0%, a difference of 0.32%).
| Demographics | Rating | Rank | Male Poverty |
| Immigrants | Kazakhstan | 64.8 /100 | #154 | Good 11.0% |
| Immigrants | Malaysia | 64.7 /100 | #155 | Good 11.0% |
| Costa Ricans | 63.9 /100 | #156 | Good 11.0% |
| Scotch-Irish | 63.7 /100 | #157 | Good 11.0% |
| Colombians | 63.0 /100 | #158 | Good 11.0% |
| Taiwanese | 62.7 /100 | #159 | Good 11.0% |
| Soviet Union | 60.3 /100 | #160 | Good 11.1% |
| Immigrants | Northern Africa | 59.7 /100 | #161 | Average 11.1% |
| Immigrants | Chile | 57.4 /100 | #162 | Average 11.1% |
| Whites/Caucasians | 56.7 /100 | #163 | Average 11.1% |
| Ethiopians | 56.7 /100 | #164 | Average 11.1% |
| Immigrants | Spain | 55.5 /100 | #165 | Average 11.1% |
| Immigrants | Albania | 55.3 /100 | #166 | Average 11.1% |
| Hungarians | 55.1 /100 | #167 | Average 11.1% |
| Immigrants | Portugal | 54.9 /100 | #168 | Average 11.1% |
Demographics Similar to Spanish by Male Poverty
In terms of male poverty, the demographic groups most similar to Spanish are Immigrants from Lebanon (11.7%, a difference of 0.10%), Iraqi (11.7%, a difference of 0.11%), Spaniard (11.7%, a difference of 0.11%), Delaware (11.7%, a difference of 0.24%), and Arab (11.6%, a difference of 0.31%).
| Demographics | Rating | Rank | Male Poverty |
| Immigrants | Uruguay | 19.1 /100 | #192 | Poor 11.6% |
| Immigrants | Kuwait | 17.3 /100 | #193 | Poor 11.6% |
| Immigrants | Kenya | 16.1 /100 | #194 | Poor 11.6% |
| Arabs | 15.8 /100 | #195 | Poor 11.6% |
| Hmong | 15.8 /100 | #196 | Poor 11.6% |
| Delaware | 15.4 /100 | #197 | Poor 11.7% |
| Iraqis | 14.7 /100 | #198 | Poor 11.7% |
| Spanish | 14.1 /100 | #199 | Poor 11.7% |
| Immigrants | Lebanon | 13.6 /100 | #200 | Poor 11.7% |
| Spaniards | 13.5 /100 | #201 | Poor 11.7% |
| Aleuts | 10.4 /100 | #202 | Poor 11.8% |
| Immigrants | Western Asia | 9.8 /100 | #203 | Tragic 11.8% |
| Immigrants | Uganda | 8.5 /100 | #204 | Tragic 11.8% |
| Panamanians | 6.2 /100 | #205 | Tragic 11.9% |
| Immigrants | Eastern Africa | 5.4 /100 | #206 | Tragic 12.0% |