Immigrants from North Macedonia vs Northern European Single Male Poverty
COMPARE
Immigrants from North Macedonia
Northern European
Single Male Poverty
Single Male Poverty Comparison
Immigrants from North Macedonia
Northern Europeans
12.3%
SINGLE MALE POVERTY
93.6/ 100
METRIC RATING
111th/ 347
METRIC RANK
13.0%
SINGLE MALE POVERTY
18.9/ 100
METRIC RATING
206th/ 347
METRIC RANK
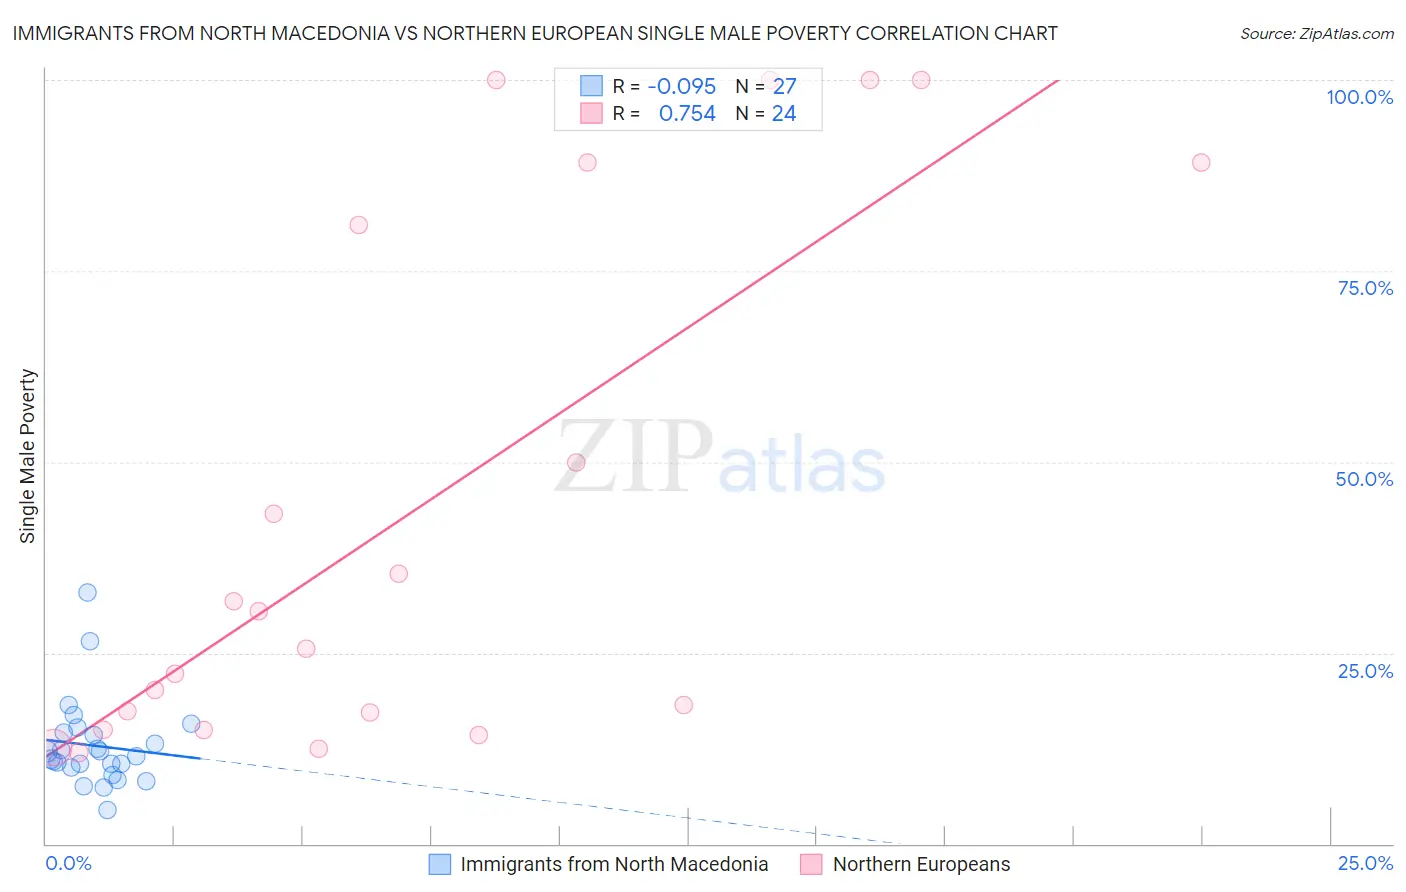
Immigrants from North Macedonia vs Northern European Single Male Poverty Correlation Chart
The statistical analysis conducted on geographies consisting of 69,458,947 people shows a slight negative correlation between the proportion of Immigrants from North Macedonia and poverty level among single males in the United States with a correlation coefficient (R) of -0.095 and weighted average of 12.3%. Similarly, the statistical analysis conducted on geographies consisting of 353,212,567 people shows a strong positive correlation between the proportion of Northern Europeans and poverty level among single males in the United States with a correlation coefficient (R) of 0.754 and weighted average of 13.0%, a difference of 5.7%.
Single Male Poverty Correlation Summary
| Measurement | Immigrants from North Macedonia | Northern European |
| Minimum | 4.5% | 12.0% |
| Maximum | 32.9% | 100.0% |
| Range | 28.4% | 88.0% |
| Mean | 12.8% | 43.8% |
| Median | 11.4% | 28.0% |
| Interquartile 25% (IQ1) | 10.0% | 16.1% |
| Interquartile 75% (IQ3) | 14.6% | 85.1% |
| Interquartile Range (IQR) | 4.6% | 69.0% |
| Standard Deviation (Sample) | 5.8% | 34.6% |
| Standard Deviation (Population) | 5.7% | 33.9% |
Similar Demographics by Single Male Poverty
Demographics Similar to Immigrants from North Macedonia by Single Male Poverty
In terms of single male poverty, the demographic groups most similar to Immigrants from North Macedonia are Immigrants from Portugal (12.3%, a difference of 0.010%), Kenyan (12.4%, a difference of 0.060%), Ugandan (12.3%, a difference of 0.24%), Pakistani (12.4%, a difference of 0.25%), and Nicaraguan (12.4%, a difference of 0.30%).
| Demographics | Rating | Rank | Single Male Poverty |
| Immigrants | Kazakhstan | 96.7 /100 | #104 | Exceptional 12.2% |
| Jordanians | 95.9 /100 | #105 | Exceptional 12.3% |
| Immigrants | Morocco | 95.6 /100 | #106 | Exceptional 12.3% |
| Iraqis | 95.1 /100 | #107 | Exceptional 12.3% |
| Immigrants | Eastern Africa | 95.0 /100 | #108 | Exceptional 12.3% |
| Ugandans | 94.5 /100 | #109 | Exceptional 12.3% |
| Immigrants | Portugal | 93.6 /100 | #110 | Exceptional 12.3% |
| Immigrants | North Macedonia | 93.6 /100 | #111 | Exceptional 12.3% |
| Kenyans | 93.3 /100 | #112 | Exceptional 12.4% |
| Pakistanis | 92.4 /100 | #113 | Exceptional 12.4% |
| Nicaraguans | 92.1 /100 | #114 | Exceptional 12.4% |
| Immigrants | Southern Europe | 91.5 /100 | #115 | Exceptional 12.4% |
| Immigrants | Syria | 91.2 /100 | #116 | Exceptional 12.4% |
| Immigrants | Oceania | 91.1 /100 | #117 | Exceptional 12.4% |
| Albanians | 90.6 /100 | #118 | Exceptional 12.4% |
Demographics Similar to Northern Europeans by Single Male Poverty
In terms of single male poverty, the demographic groups most similar to Northern Europeans are Polish (13.0%, a difference of 0.040%), Sudanese (13.1%, a difference of 0.10%), Immigrants from Western Africa (13.1%, a difference of 0.11%), Immigrants from Bangladesh (13.0%, a difference of 0.12%), and Estonian (13.0%, a difference of 0.12%).
| Demographics | Rating | Rank | Single Male Poverty |
| Immigrants | Norway | 21.8 /100 | #199 | Fair 13.0% |
| Slovenes | 21.6 /100 | #200 | Fair 13.0% |
| Trinidadians and Tobagonians | 21.4 /100 | #201 | Fair 13.0% |
| Basques | 20.7 /100 | #202 | Fair 13.0% |
| Immigrants | Bangladesh | 20.4 /100 | #203 | Fair 13.0% |
| Estonians | 20.3 /100 | #204 | Fair 13.0% |
| Poles | 19.3 /100 | #205 | Poor 13.0% |
| Northern Europeans | 18.9 /100 | #206 | Poor 13.0% |
| Sudanese | 17.7 /100 | #207 | Poor 13.1% |
| Immigrants | Western Africa | 17.6 /100 | #208 | Poor 13.1% |
| Mexican American Indians | 17.5 /100 | #209 | Poor 13.1% |
| Immigrants | Haiti | 16.8 /100 | #210 | Poor 13.1% |
| Swedes | 16.8 /100 | #211 | Poor 13.1% |
| Senegalese | 16.4 /100 | #212 | Poor 13.1% |
| Italians | 15.9 /100 | #213 | Poor 13.1% |