Immigrants from North Macedonia vs Iraqi Male Poverty
COMPARE
Immigrants from North Macedonia
Iraqi
Male Poverty
Male Poverty Comparison
Immigrants from North Macedonia
Iraqis
9.4%
MALE POVERTY
99.8/ 100
METRIC RATING
14th/ 347
METRIC RANK
11.7%
MALE POVERTY
14.7/ 100
METRIC RATING
198th/ 347
METRIC RANK
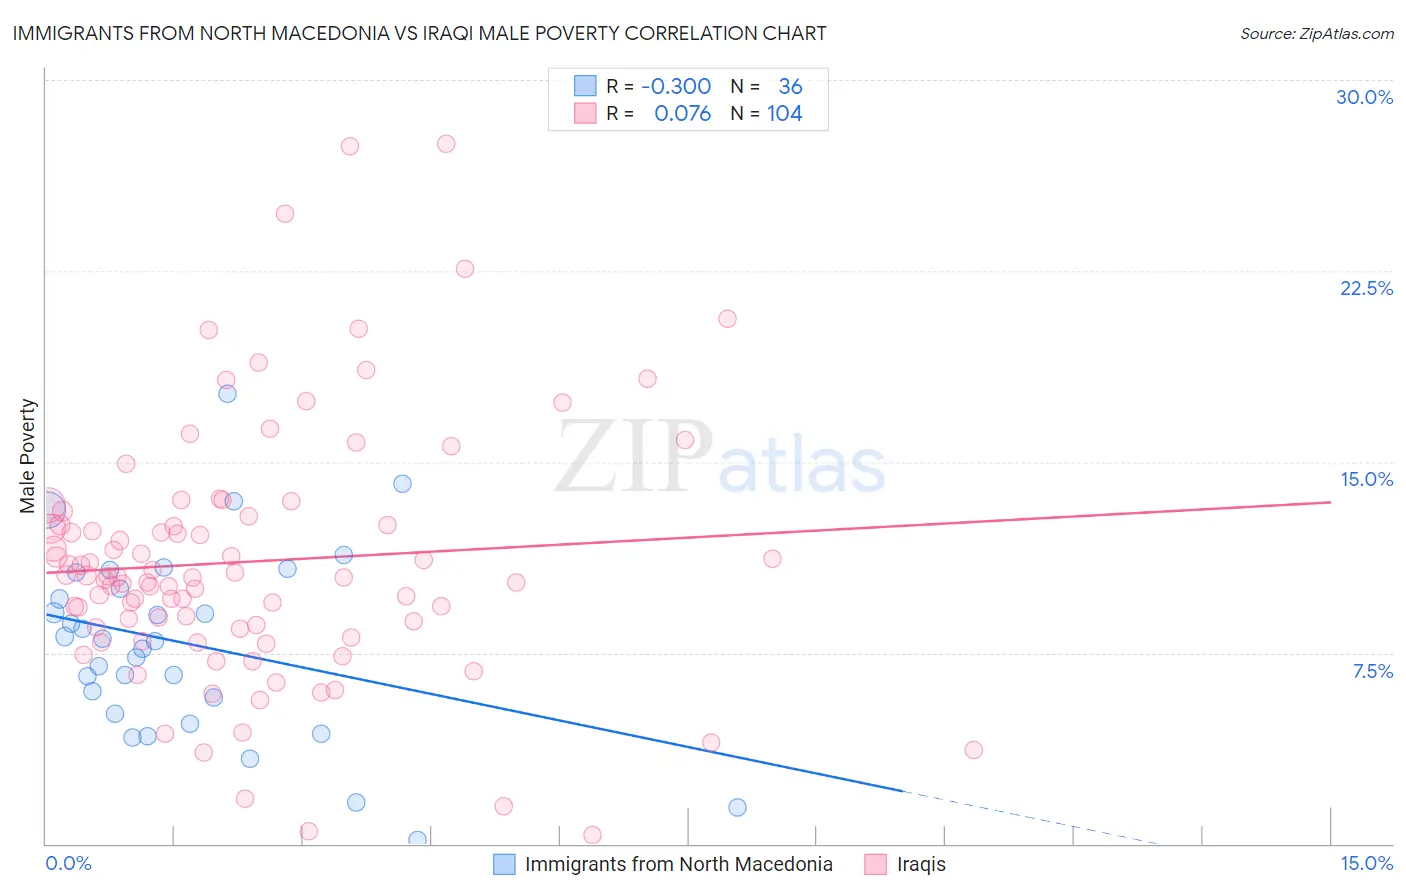
Immigrants from North Macedonia vs Iraqi Male Poverty Correlation Chart
The statistical analysis conducted on geographies consisting of 74,289,354 people shows a weak negative correlation between the proportion of Immigrants from North Macedonia and poverty level among males in the United States with a correlation coefficient (R) of -0.300 and weighted average of 9.4%. Similarly, the statistical analysis conducted on geographies consisting of 170,573,480 people shows a slight positive correlation between the proportion of Iraqis and poverty level among males in the United States with a correlation coefficient (R) of 0.076 and weighted average of 11.7%, a difference of 23.6%.
Male Poverty Correlation Summary
| Measurement | Immigrants from North Macedonia | Iraqi |
| Minimum | 0.15% | 0.32% |
| Maximum | 17.7% | 27.5% |
| Range | 17.6% | 27.2% |
| Mean | 7.9% | 11.1% |
| Median | 8.0% | 10.5% |
| Interquartile 25% (IQ1) | 5.4% | 8.5% |
| Interquartile 75% (IQ3) | 10.3% | 12.7% |
| Interquartile Range (IQR) | 4.9% | 4.2% |
| Standard Deviation (Sample) | 3.7% | 5.0% |
| Standard Deviation (Population) | 3.7% | 5.0% |
Similar Demographics by Male Poverty
Demographics Similar to Immigrants from North Macedonia by Male Poverty
In terms of male poverty, the demographic groups most similar to Immigrants from North Macedonia are Bhutanese (9.5%, a difference of 0.29%), Immigrants from Lithuania (9.4%, a difference of 0.38%), Immigrants from Bolivia (9.4%, a difference of 0.50%), Bolivian (9.4%, a difference of 0.56%), and Luxembourger (9.5%, a difference of 0.81%).
| Demographics | Rating | Rank | Male Poverty |
| Immigrants | Ireland | 99.9 /100 | #7 | Exceptional 9.1% |
| Filipinos | 99.9 /100 | #8 | Exceptional 9.2% |
| Immigrants | South Central Asia | 99.9 /100 | #9 | Exceptional 9.3% |
| Bulgarians | 99.9 /100 | #10 | Exceptional 9.3% |
| Bolivians | 99.9 /100 | #11 | Exceptional 9.4% |
| Immigrants | Bolivia | 99.9 /100 | #12 | Exceptional 9.4% |
| Immigrants | Lithuania | 99.9 /100 | #13 | Exceptional 9.4% |
| Immigrants | North Macedonia | 99.8 /100 | #14 | Exceptional 9.4% |
| Bhutanese | 99.8 /100 | #15 | Exceptional 9.5% |
| Luxembourgers | 99.8 /100 | #16 | Exceptional 9.5% |
| Norwegians | 99.8 /100 | #17 | Exceptional 9.5% |
| Lithuanians | 99.8 /100 | #18 | Exceptional 9.5% |
| Immigrants | Hong Kong | 99.7 /100 | #19 | Exceptional 9.6% |
| Latvians | 99.7 /100 | #20 | Exceptional 9.6% |
| Immigrants | Scotland | 99.7 /100 | #21 | Exceptional 9.6% |
Demographics Similar to Iraqis by Male Poverty
In terms of male poverty, the demographic groups most similar to Iraqis are Spanish (11.7%, a difference of 0.11%), Delaware (11.7%, a difference of 0.14%), Hmong (11.6%, a difference of 0.20%), Arab (11.6%, a difference of 0.21%), and Immigrants from Lebanon (11.7%, a difference of 0.21%).
| Demographics | Rating | Rank | Male Poverty |
| South American Indians | 22.8 /100 | #191 | Fair 11.5% |
| Immigrants | Uruguay | 19.1 /100 | #192 | Poor 11.6% |
| Immigrants | Kuwait | 17.3 /100 | #193 | Poor 11.6% |
| Immigrants | Kenya | 16.1 /100 | #194 | Poor 11.6% |
| Arabs | 15.8 /100 | #195 | Poor 11.6% |
| Hmong | 15.8 /100 | #196 | Poor 11.6% |
| Delaware | 15.4 /100 | #197 | Poor 11.7% |
| Iraqis | 14.7 /100 | #198 | Poor 11.7% |
| Spanish | 14.1 /100 | #199 | Poor 11.7% |
| Immigrants | Lebanon | 13.6 /100 | #200 | Poor 11.7% |
| Spaniards | 13.5 /100 | #201 | Poor 11.7% |
| Aleuts | 10.4 /100 | #202 | Poor 11.8% |
| Immigrants | Western Asia | 9.8 /100 | #203 | Tragic 11.8% |
| Immigrants | Uganda | 8.5 /100 | #204 | Tragic 11.8% |
| Panamanians | 6.2 /100 | #205 | Tragic 11.9% |