Immigrants from North America vs Navajo Female Poverty
COMPARE
Immigrants from North America
Navajo
Female Poverty
Female Poverty Comparison
Immigrants from North America
Navajo
12.3%
FEMALE POVERTY
97.1/ 100
METRIC RATING
79th/ 347
METRIC RANK
23.9%
FEMALE POVERTY
0.0/ 100
METRIC RATING
345th/ 347
METRIC RANK
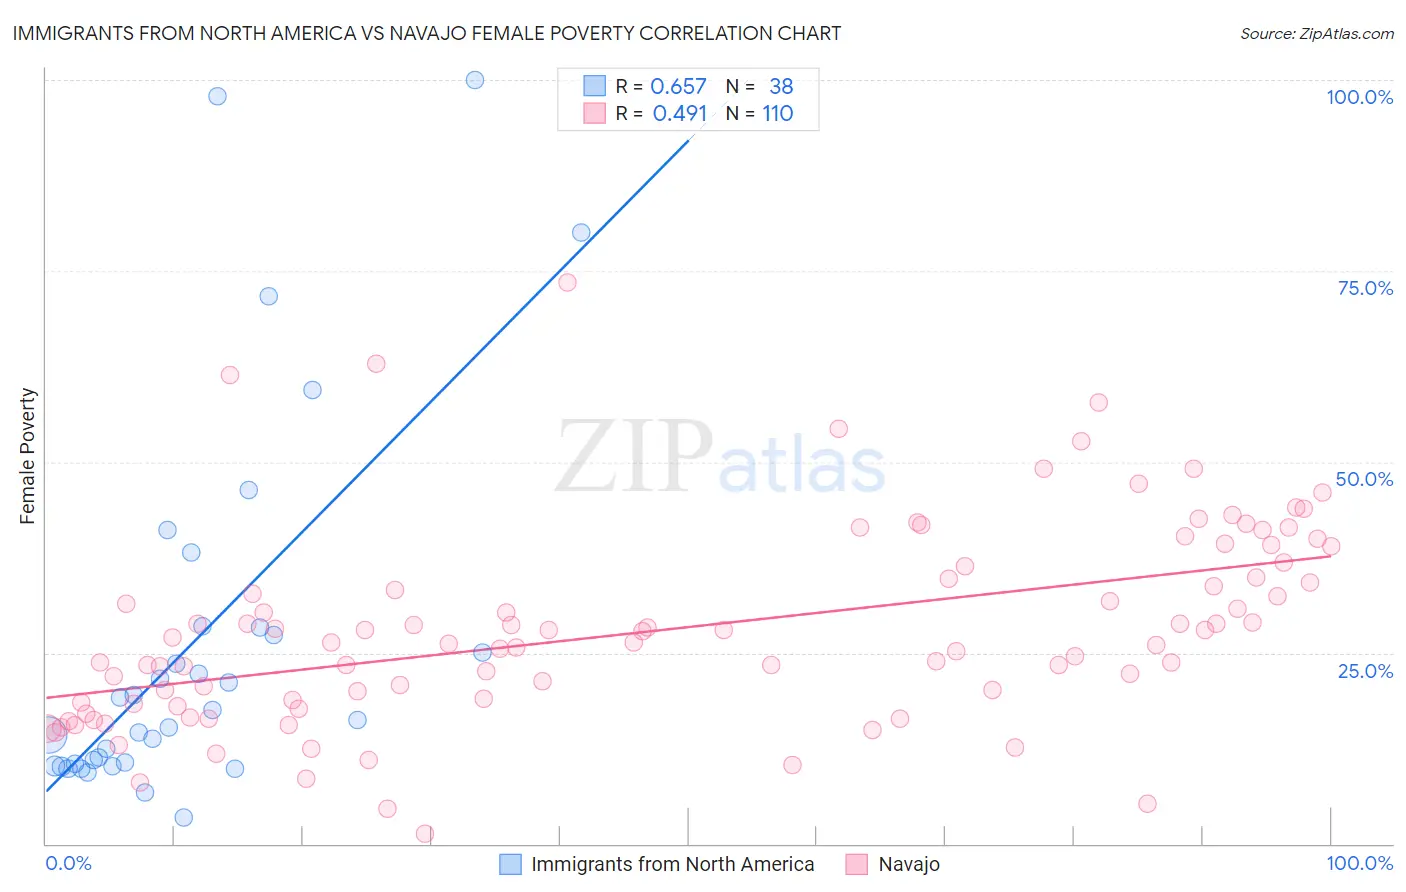
Immigrants from North America vs Navajo Female Poverty Correlation Chart
The statistical analysis conducted on geographies consisting of 462,028,692 people shows a significant positive correlation between the proportion of Immigrants from North America and poverty level among females in the United States with a correlation coefficient (R) of 0.657 and weighted average of 12.3%. Similarly, the statistical analysis conducted on geographies consisting of 224,729,638 people shows a moderate positive correlation between the proportion of Navajo and poverty level among females in the United States with a correlation coefficient (R) of 0.491 and weighted average of 23.9%, a difference of 94.2%.
Female Poverty Correlation Summary
| Measurement | Immigrants from North America | Navajo |
| Minimum | 3.5% | 1.4% |
| Maximum | 100.0% | 73.5% |
| Range | 96.5% | 72.1% |
| Mean | 26.2% | 28.0% |
| Median | 16.9% | 26.3% |
| Interquartile 25% (IQ1) | 10.5% | 18.5% |
| Interquartile 75% (IQ3) | 28.3% | 34.9% |
| Interquartile Range (IQR) | 17.9% | 16.4% |
| Standard Deviation (Sample) | 24.5% | 13.1% |
| Standard Deviation (Population) | 24.2% | 13.0% |
Similar Demographics by Female Poverty
Demographics Similar to Immigrants from North America by Female Poverty
In terms of female poverty, the demographic groups most similar to Immigrants from North America are Slovak (12.3%, a difference of 0.050%), Immigrants from Sweden (12.3%, a difference of 0.050%), Jordanian (12.3%, a difference of 0.060%), Egyptian (12.3%, a difference of 0.070%), and Serbian (12.3%, a difference of 0.080%).
| Demographics | Rating | Rank | Female Poverty |
| Cambodians | 97.5 /100 | #72 | Exceptional 12.2% |
| Zimbabweans | 97.5 /100 | #73 | Exceptional 12.3% |
| Immigrants | Canada | 97.5 /100 | #74 | Exceptional 12.3% |
| Europeans | 97.4 /100 | #75 | Exceptional 12.3% |
| Immigrants | Eastern Europe | 97.2 /100 | #76 | Exceptional 12.3% |
| Serbians | 97.2 /100 | #77 | Exceptional 12.3% |
| Egyptians | 97.2 /100 | #78 | Exceptional 12.3% |
| Immigrants | North America | 97.1 /100 | #79 | Exceptional 12.3% |
| Slovaks | 97.1 /100 | #80 | Exceptional 12.3% |
| Immigrants | Sweden | 97.1 /100 | #81 | Exceptional 12.3% |
| Jordanians | 97.1 /100 | #82 | Exceptional 12.3% |
| Immigrants | England | 96.9 /100 | #83 | Exceptional 12.3% |
| Northern Europeans | 96.6 /100 | #84 | Exceptional 12.4% |
| Irish | 96.5 /100 | #85 | Exceptional 12.4% |
| Dutch | 96.5 /100 | #86 | Exceptional 12.4% |
Demographics Similar to Navajo by Female Poverty
In terms of female poverty, the demographic groups most similar to Navajo are Pima (23.6%, a difference of 1.3%), Lumbee (23.5%, a difference of 1.6%), Immigrants from Yemen (22.8%, a difference of 4.6%), Puerto Rican (25.2%, a difference of 5.4%), and Crow (22.1%, a difference of 7.9%).
| Demographics | Rating | Rank | Female Poverty |
| Immigrants | Dominican Republic | 0.0 /100 | #333 | Tragic 19.3% |
| Houma | 0.0 /100 | #334 | Tragic 20.0% |
| Cheyenne | 0.0 /100 | #335 | Tragic 20.2% |
| Pueblo | 0.0 /100 | #336 | Tragic 20.7% |
| Yuman | 0.0 /100 | #337 | Tragic 20.8% |
| Sioux | 0.0 /100 | #338 | Tragic 20.9% |
| Hopi | 0.0 /100 | #339 | Tragic 21.0% |
| Yup'ik | 0.0 /100 | #340 | Tragic 21.5% |
| Crow | 0.0 /100 | #341 | Tragic 22.1% |
| Immigrants | Yemen | 0.0 /100 | #342 | Tragic 22.8% |
| Lumbee | 0.0 /100 | #343 | Tragic 23.5% |
| Pima | 0.0 /100 | #344 | Tragic 23.6% |
| Navajo | 0.0 /100 | #345 | Tragic 23.9% |
| Puerto Ricans | 0.0 /100 | #346 | Tragic 25.2% |
| Tohono O'odham | 0.0 /100 | #347 | Tragic 25.9% |