Immigrants from North America vs Immigrants from Kuwait Seniors Poverty Over the Age of 65
COMPARE
Immigrants from North America
Immigrants from Kuwait
Seniors Poverty Over the Age of 65
Seniors Poverty Over the Age of 65 Comparison
Immigrants from North America
Immigrants from Kuwait
9.9%
SENIORS POVERTY OVER THE AGE OF 65
98.8/ 100
METRIC RATING
64th/ 347
METRIC RANK
10.2%
SENIORS POVERTY OVER THE AGE OF 65
95.5/ 100
METRIC RATING
98th/ 347
METRIC RANK
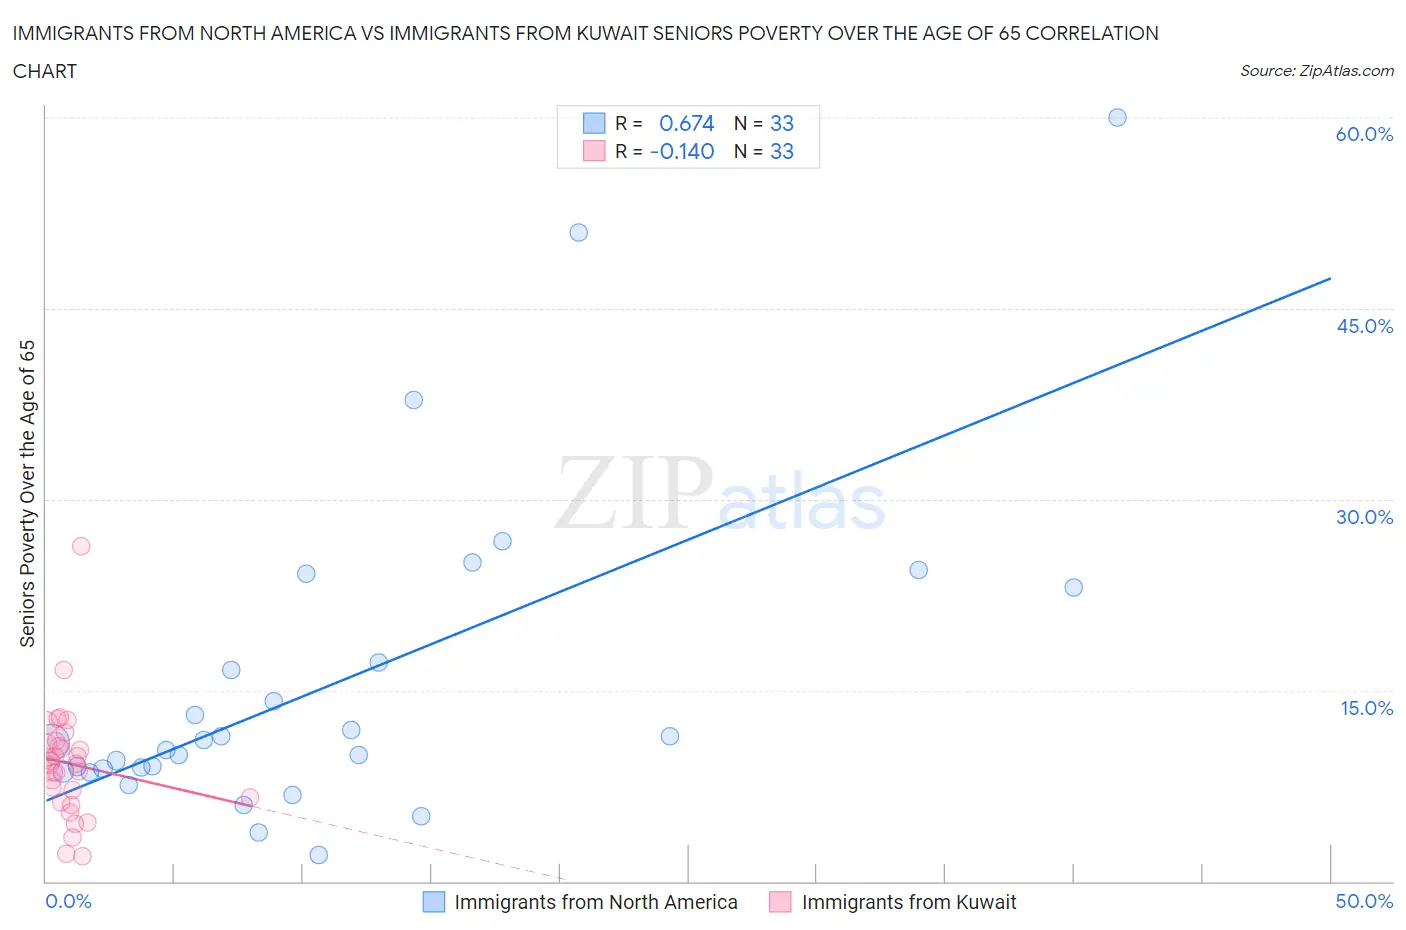
Immigrants from North America vs Immigrants from Kuwait Seniors Poverty Over the Age of 65 Correlation Chart
The statistical analysis conducted on geographies consisting of 460,378,819 people shows a significant positive correlation between the proportion of Immigrants from North America and poverty level among seniors over the age of 65 in the United States with a correlation coefficient (R) of 0.674 and weighted average of 9.9%. Similarly, the statistical analysis conducted on geographies consisting of 136,807,849 people shows a poor negative correlation between the proportion of Immigrants from Kuwait and poverty level among seniors over the age of 65 in the United States with a correlation coefficient (R) of -0.140 and weighted average of 10.2%, a difference of 3.4%.
Seniors Poverty Over the Age of 65 Correlation Summary
| Measurement | Immigrants from North America | Immigrants from Kuwait |
| Minimum | 2.1% | 1.9% |
| Maximum | 60.0% | 26.3% |
| Range | 57.9% | 24.3% |
| Mean | 15.6% | 9.2% |
| Median | 10.9% | 9.3% |
| Interquartile 25% (IQ1) | 8.7% | 6.4% |
| Interquartile 75% (IQ3) | 20.1% | 10.9% |
| Interquartile Range (IQR) | 11.4% | 4.5% |
| Standard Deviation (Sample) | 12.9% | 4.5% |
| Standard Deviation (Population) | 12.7% | 4.4% |
Similar Demographics by Seniors Poverty Over the Age of 65
Demographics Similar to Immigrants from North America by Seniors Poverty Over the Age of 65
In terms of seniors poverty over the age of 65, the demographic groups most similar to Immigrants from North America are Macedonian (9.9%, a difference of 0.050%), French Canadian (9.8%, a difference of 0.23%), Iranian (9.8%, a difference of 0.27%), Pennsylvania German (9.9%, a difference of 0.28%), and Immigrants from Netherlands (9.9%, a difference of 0.33%).
| Demographics | Rating | Rank | Seniors Poverty Over the Age of 65 |
| Bolivians | 99.1 /100 | #57 | Exceptional 9.8% |
| Serbians | 99.1 /100 | #58 | Exceptional 9.8% |
| Immigrants | Canada | 99.0 /100 | #59 | Exceptional 9.8% |
| Celtics | 99.0 /100 | #60 | Exceptional 9.8% |
| Iranians | 98.9 /100 | #61 | Exceptional 9.8% |
| French Canadians | 98.9 /100 | #62 | Exceptional 9.8% |
| Macedonians | 98.8 /100 | #63 | Exceptional 9.9% |
| Immigrants | North America | 98.8 /100 | #64 | Exceptional 9.9% |
| Pennsylvania Germans | 98.7 /100 | #65 | Exceptional 9.9% |
| Immigrants | Netherlands | 98.7 /100 | #66 | Exceptional 9.9% |
| Immigrants | Austria | 98.6 /100 | #67 | Exceptional 9.9% |
| Canadians | 98.5 /100 | #68 | Exceptional 9.9% |
| Australians | 98.4 /100 | #69 | Exceptional 9.9% |
| Samoans | 98.0 /100 | #70 | Exceptional 10.0% |
| Yugoslavians | 97.9 /100 | #71 | Exceptional 10.0% |
Demographics Similar to Immigrants from Kuwait by Seniors Poverty Over the Age of 65
In terms of seniors poverty over the age of 65, the demographic groups most similar to Immigrants from Kuwait are Cypriot (10.2%, a difference of 0.0%), Marshallese (10.2%, a difference of 0.070%), Immigrants from Pakistan (10.2%, a difference of 0.16%), Basque (10.2%, a difference of 0.24%), and Immigrants from Jordan (10.2%, a difference of 0.39%).
| Demographics | Rating | Rank | Seniors Poverty Over the Age of 65 |
| Puget Sound Salish | 96.9 /100 | #91 | Exceptional 10.1% |
| Immigrants | Singapore | 96.9 /100 | #92 | Exceptional 10.1% |
| Immigrants | Sweden | 96.7 /100 | #93 | Exceptional 10.1% |
| Immigrants | Germany | 96.7 /100 | #94 | Exceptional 10.1% |
| Immigrants | Japan | 96.3 /100 | #95 | Exceptional 10.1% |
| Basques | 95.9 /100 | #96 | Exceptional 10.2% |
| Immigrants | Pakistan | 95.7 /100 | #97 | Exceptional 10.2% |
| Immigrants | Kuwait | 95.5 /100 | #98 | Exceptional 10.2% |
| Cypriots | 95.5 /100 | #99 | Exceptional 10.2% |
| Marshallese | 95.3 /100 | #100 | Exceptional 10.2% |
| Immigrants | Jordan | 94.7 /100 | #101 | Exceptional 10.2% |
| Delaware | 94.5 /100 | #102 | Exceptional 10.2% |
| Icelanders | 94.4 /100 | #103 | Exceptional 10.3% |
| South Africans | 94.3 /100 | #104 | Exceptional 10.3% |
| Aleuts | 94.1 /100 | #105 | Exceptional 10.3% |