Immigrants from Nigeria vs Burmese Single Female Poverty
COMPARE
Immigrants from Nigeria
Burmese
Single Female Poverty
Single Female Poverty Comparison
Immigrants from Nigeria
Burmese
21.2%
SINGLE FEMALE POVERTY
36.8/ 100
METRIC RATING
187th/ 347
METRIC RANK
18.3%
SINGLE FEMALE POVERTY
100.0/ 100
METRIC RATING
22nd/ 347
METRIC RANK
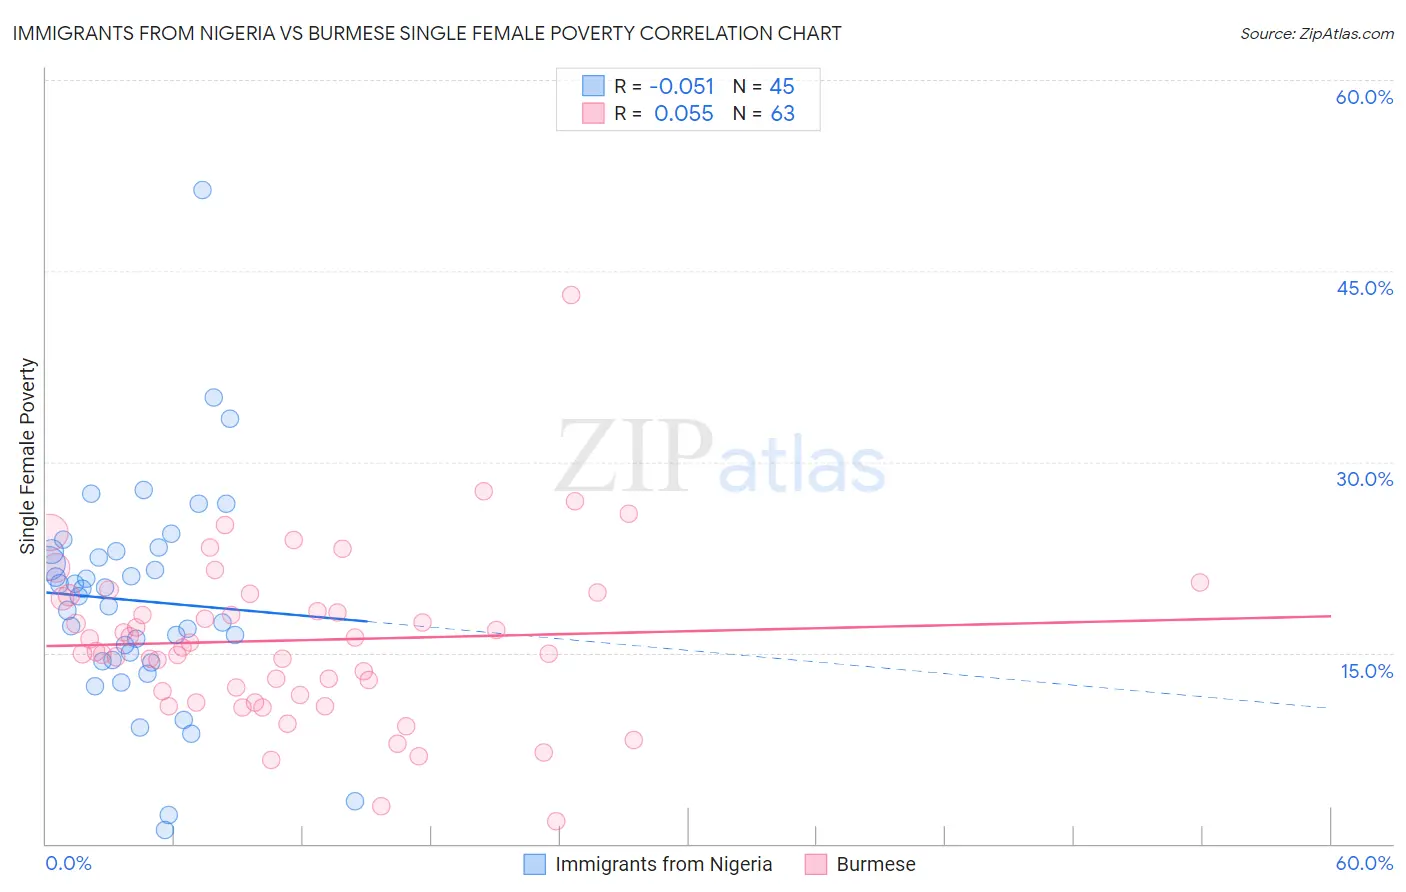
Immigrants from Nigeria vs Burmese Single Female Poverty Correlation Chart
The statistical analysis conducted on geographies consisting of 281,424,255 people shows a slight negative correlation between the proportion of Immigrants from Nigeria and poverty level among single females in the United States with a correlation coefficient (R) of -0.051 and weighted average of 21.2%. Similarly, the statistical analysis conducted on geographies consisting of 455,450,200 people shows a slight positive correlation between the proportion of Burmese and poverty level among single females in the United States with a correlation coefficient (R) of 0.055 and weighted average of 18.3%, a difference of 15.9%.
Single Female Poverty Correlation Summary
| Measurement | Immigrants from Nigeria | Burmese |
| Minimum | 1.1% | 1.8% |
| Maximum | 51.4% | 43.2% |
| Range | 50.2% | 41.3% |
| Mean | 19.1% | 16.0% |
| Median | 19.4% | 15.4% |
| Interquartile 25% (IQ1) | 14.4% | 11.7% |
| Interquartile 75% (IQ3) | 23.0% | 19.5% |
| Interquartile Range (IQR) | 8.6% | 7.9% |
| Standard Deviation (Sample) | 8.7% | 6.6% |
| Standard Deviation (Population) | 8.6% | 6.5% |
Similar Demographics by Single Female Poverty
Demographics Similar to Immigrants from Nigeria by Single Female Poverty
In terms of single female poverty, the demographic groups most similar to Immigrants from Nigeria are Hawaiian (21.2%, a difference of 0.060%), Yugoslavian (21.2%, a difference of 0.090%), Immigrants from Cambodia (21.2%, a difference of 0.10%), Immigrants from Cuba (21.2%, a difference of 0.10%), and Trinidadian and Tobagonian (21.2%, a difference of 0.10%).
| Demographics | Rating | Rank | Single Female Poverty |
| Spanish American Indians | 42.5 /100 | #180 | Average 21.1% |
| Europeans | 42.3 /100 | #181 | Average 21.1% |
| Slavs | 40.5 /100 | #182 | Average 21.1% |
| Slovaks | 39.7 /100 | #183 | Fair 21.1% |
| Hungarians | 39.6 /100 | #184 | Fair 21.1% |
| Immigrants | Cambodia | 38.2 /100 | #185 | Fair 21.2% |
| Hawaiians | 37.7 /100 | #186 | Fair 21.2% |
| Immigrants | Nigeria | 36.8 /100 | #187 | Fair 21.2% |
| Yugoslavians | 35.4 /100 | #188 | Fair 21.2% |
| Immigrants | Cuba | 35.3 /100 | #189 | Fair 21.2% |
| Trinidadians and Tobagonians | 35.2 /100 | #190 | Fair 21.2% |
| Immigrants | Germany | 31.1 /100 | #191 | Fair 21.3% |
| Immigrants | Jamaica | 30.5 /100 | #192 | Fair 21.3% |
| Basques | 28.1 /100 | #193 | Fair 21.3% |
| Czechoslovakians | 27.7 /100 | #194 | Fair 21.3% |
Demographics Similar to Burmese by Single Female Poverty
In terms of single female poverty, the demographic groups most similar to Burmese are Asian (18.3%, a difference of 0.0%), Maltese (18.3%, a difference of 0.010%), Immigrants from Greece (18.3%, a difference of 0.070%), Armenian (18.3%, a difference of 0.23%), and Immigrants from Singapore (18.3%, a difference of 0.33%).
| Demographics | Rating | Rank | Single Female Poverty |
| Indians (Asian) | 100.0 /100 | #15 | Exceptional 17.9% |
| Iranians | 100.0 /100 | #16 | Exceptional 18.0% |
| Immigrants | Korea | 100.0 /100 | #17 | Exceptional 18.1% |
| Immigrants | Eastern Asia | 100.0 /100 | #18 | Exceptional 18.1% |
| Immigrants | China | 100.0 /100 | #19 | Exceptional 18.1% |
| Immigrants | Greece | 100.0 /100 | #20 | Exceptional 18.3% |
| Maltese | 100.0 /100 | #21 | Exceptional 18.3% |
| Burmese | 100.0 /100 | #22 | Exceptional 18.3% |
| Asians | 100.0 /100 | #23 | Exceptional 18.3% |
| Armenians | 100.0 /100 | #24 | Exceptional 18.3% |
| Immigrants | Singapore | 100.0 /100 | #25 | Exceptional 18.3% |
| Immigrants | Israel | 100.0 /100 | #26 | Exceptional 18.3% |
| Immigrants | Pakistan | 100.0 /100 | #27 | Exceptional 18.4% |
| Immigrants | Moldova | 100.0 /100 | #28 | Exceptional 18.5% |
| Immigrants | Poland | 100.0 /100 | #29 | Exceptional 18.5% |