Immigrants from Nicaragua vs Salvadoran Single Father Poverty

COMPARE

Immigrants from Nicaragua
Race
Ancestry
AfghanAfricanAlaska NativeAlaskan AthabascanAlbanianAleutAlsatianAmericanApacheArabArapahoArgentineanArmenianAssyrian/Chaldean/SyriacAustralianAustrianBahamianBangladeshiBarbadianBasqueBelgianBelizeanBermudanBhutaneseBlackfeetBolivianBrazilianBritishBritish West IndianBulgarianBurmeseCajunCambodianCanadianCape VerdeanCarpatho RusynCelticCentral AmericanCentral American IndianCherokeeCheyenneChickasawChileanChineseChippewaChoctawColombianColvilleComancheCosta RicanCreeCreekCroatianCrowCubanCypriotCzechCzechoslovakianDanishDelawareDominicanDutchDutch West IndianEastern EuropeanEcuadorianEgyptianEnglishEstonianEthiopianEuropeanFijianFilipinoFinnishFrenchFrench American IndianFrench CanadianGermanGerman RussianGhanaianGreekGuamanian/ChamorroGuatemalanGuyaneseHaitianHmongHonduranHopiHoumaHungarianIcelanderIndian (Asian)IndonesianInupiatIranianIraqiIrishIroquoisIsraeliItalianJamaicanJapaneseJordanianKenyanKiowaKoreanLaotianLatvianLebaneseLiberianLithuanianLumbeeLuxembourgerMacedonianMalaysianMalteseMarshalleseMenomineeMexicanMexican American IndianMongolianMoroccanNative HawaiianNavajoNepaleseNew ZealanderNicaraguanNigerianNorthern EuropeanNorwegianOkinawanOsageOttawaPaiutePakistaniPalestinianPanamanianParaguayanPennsylvania GermanPeruvianPimaPolishPortuguesePotawatomiPuebloPuerto RicanPuget Sound SalishRomanianRussianSamoanScandinavianScotch-IrishScottishSeminoleSenegaleseSerbianShoshoneSierra LeoneanSiouxSlavicSlovakSloveneSomaliSouth AfricanSouth AmericanSouth American IndianSoviet UnionSpaniardSpanishSpanish AmericanSpanish American IndianSri LankanSubsaharan AfricanSudaneseSwedishSwissSyrianTaiwaneseThaiTlingit-HaidaTohono O'OdhamTonganTrinidadian and TobagonianTsimshianTurkishU.S. Virgin IslanderUgandanUkrainianUruguayanUteVenezuelanVietnameseWelshWest IndianYakamaYaquiYugoslavianYumanYup'ikZimbabwean
Immigration
NonimmigrantsImmigrantsAfghanistanAfricaAlbaniaArgentinaArmeniaAsiaAustraliaAustriaBahamasBangladeshBarbadosBelarusBelgiumBelizeBoliviaBosnia and HerzegovinaBrazilBulgariaBurma/MyanmarCabo VerdeCambodiaCameroonCanadaCaribbeanCentral AmericaChileChinaColombiaCongoCosta RicaCroatiaCubaCzechoslovakiaDenmarkDominicaDominican RepublicEastern AfricaEastern AsiaEastern EuropeEcuadorEgyptEl SalvadorEnglandEritreaEthiopiaEuropeFijiFranceGermanyGhanaGreeceGrenadaGuatemalaGuyanaHaitiHondurasHong KongHungaryIndiaIndonesiaIranIraqIrelandIsraelItalyJamaicaJapanJordanKazakhstanKenyaKoreaKuwaitLaosLatin AmericaLatviaLebanonLiberiaLithuaniaMalaysiaMexicoMicronesiaMiddle AfricaMoldovaMoroccoNepalNetherlandsNicaraguaNigeriaNorth AmericaNorth MacedoniaNorthern AfricaNorthern EuropeNorwayOceaniaPakistanPanamaPeruPhilippinesPolandPortugalRomaniaRussiaSaudi ArabiaScotlandSenegalSerbiaSierra LeoneSingaporeSomaliaSouth AfricaSouth AmericaSouth Central AsiaSouth Eastern AsiaSouthern EuropeSpainSri LankaSt. Vincent and the GrenadinesSudanSwedenSwitzerlandSyriaTaiwanThailandTrinidad and TobagoTurkeyUgandaUkraineUruguayUzbekistanVenezuelaVietnamWest IndiesWestern AfricaWestern AsiaWestern EuropeYemenZaireZimbabweAzores
Salvadoran
Race
Ancestry
AfghanAfricanAlaska NativeAlaskan AthabascanAlbanianAleutAlsatianAmericanApacheArabArapahoArgentineanArmenianAssyrian/Chaldean/SyriacAustralianAustrianBahamianBangladeshiBarbadianBasqueBelgianBelizeanBermudanBhutaneseBlackfeetBolivianBrazilianBritishBritish West IndianBulgarianBurmeseCajunCambodianCanadianCape VerdeanCarpatho RusynCelticCentral AmericanCentral American IndianCherokeeCheyenneChickasawChileanChineseChippewaChoctawColombianColvilleComancheCosta RicanCreeCreekCroatianCrowCubanCypriotCzechCzechoslovakianDanishDelawareDominicanDutchDutch West IndianEastern EuropeanEcuadorianEgyptianEnglishEstonianEthiopianEuropeanFijianFilipinoFinnishFrenchFrench American IndianFrench CanadianGermanGerman RussianGhanaianGreekGuamanian/ChamorroGuatemalanGuyaneseHaitianHmongHonduranHopiHoumaHungarianIcelanderIndian (Asian)IndonesianInupiatIranianIraqiIrishIroquoisIsraeliItalianJamaicanJapaneseJordanianKenyanKiowaKoreanLaotianLatvianLebaneseLiberianLithuanianLumbeeLuxembourgerMacedonianMalaysianMalteseMarshalleseMenomineeMexicanMexican American IndianMongolianMoroccanNative HawaiianNavajoNepaleseNew ZealanderNicaraguanNigerianNorthern EuropeanNorwegianOkinawanOsageOttawaPaiutePakistaniPalestinianPanamanianParaguayanPennsylvania GermanPeruvianPimaPolishPortuguesePotawatomiPuebloPuerto RicanPuget Sound SalishRomanianRussianSalvadoranSamoanScandinavianScotch-IrishScottishSeminoleSenegaleseSerbianShoshoneSierra LeoneanSiouxSlavicSlovakSloveneSomaliSouth AfricanSouth AmericanSouth American IndianSoviet UnionSpaniardSpanishSpanish AmericanSpanish American IndianSri LankanSubsaharan AfricanSudaneseSwedishSwissSyrianTaiwaneseThaiTlingit-HaidaTohono O'OdhamTonganTrinidadian and TobagonianTsimshianTurkishU.S. Virgin IslanderUgandanUkrainianUruguayanUteVenezuelanVietnameseWelshWest IndianYakamaYaquiYugoslavianYumanYup'ikZimbabwean
Immigration
NonimmigrantsImmigrantsAfghanistanAfricaAlbaniaArgentinaArmeniaAsiaAustraliaAustriaBahamasBangladeshBarbadosBelarusBelgiumBelizeBoliviaBosnia and HerzegovinaBrazilBulgariaBurma/MyanmarCabo VerdeCambodiaCameroonCanadaCaribbeanCentral AmericaChileChinaColombiaCongoCosta RicaCroatiaCubaCzechoslovakiaDenmarkDominicaDominican RepublicEastern AfricaEastern AsiaEastern EuropeEcuadorEgyptEl SalvadorEnglandEritreaEthiopiaEuropeFijiFranceGermanyGhanaGreeceGrenadaGuatemalaGuyanaHaitiHondurasHong KongHungaryIndiaIndonesiaIranIraqIrelandIsraelItalyJamaicaJapanJordanKazakhstanKenyaKoreaKuwaitLaosLatin AmericaLatviaLebanonLiberiaLithuaniaMalaysiaMexicoMicronesiaMiddle AfricaMoldovaMoroccoNepalNetherlandsNigeriaNorth AmericaNorth MacedoniaNorthern AfricaNorthern EuropeNorwayOceaniaPakistanPanamaPeruPhilippinesPolandPortugalRomaniaRussiaSaudi ArabiaScotlandSenegalSerbiaSierra LeoneSingaporeSomaliaSouth AfricaSouth AmericaSouth Central AsiaSouth Eastern AsiaSouthern EuropeSpainSri LankaSt. Vincent and the GrenadinesSudanSwedenSwitzerlandSyriaTaiwanThailandTrinidad and TobagoTurkeyUgandaUkraineUruguayUzbekistanVenezuelaVietnamWest IndiesWestern AfricaWestern AsiaWestern EuropeYemenZaireZimbabweAzores
Single Father Poverty
Income
Poverty
Unemployment
Labor Participation
Family Structure
Vehicle Availability
Education Level
Disability

Single Father Poverty Comparison

Immigrants from Nicaragua

Salvadorans

Good
Exceptional
16.2%
SINGLE FATHER POVERTY
67.8/ 100
METRIC RATING
155th/ 347
METRIC RANK
14.9%
SINGLE FATHER POVERTY
100.0/ 100
METRIC RATING
44th/ 347
METRIC RANK

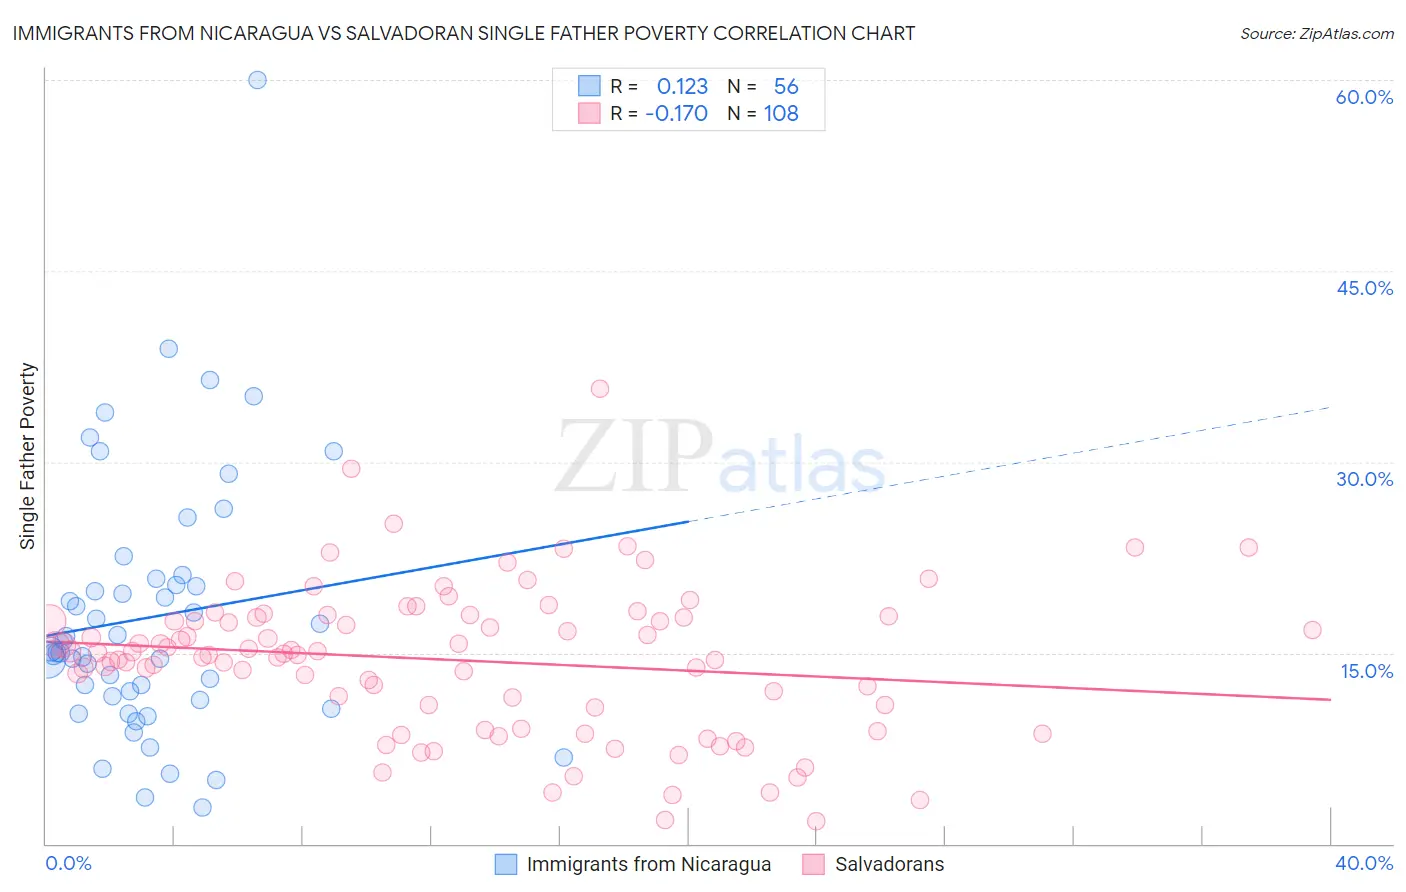
Immigrants from Nicaragua vs Salvadoran Single Father Poverty Correlation Chart

The statistical analysis conducted on geographies consisting of 204,495,523 people shows a poor positive correlation between the proportion of Immigrants from Nicaragua and poverty level among single fathers in the United States with a correlation coefficient (R) of 0.123 and weighted average of 16.2%. Similarly, the statistical analysis conducted on geographies consisting of 320,267,289 people shows a poor negative correlation between the proportion of Salvadorans and poverty level among single fathers in the United States with a correlation coefficient (R) of -0.170 and weighted average of 14.9%, a difference of 8.5%.
Immigrants from Nicaragua vs Salvadoran Single Father Poverty

Single Father Poverty Correlation Summary

MeasurementImmigrants from NicaraguaSalvadoran
Minimum2.8%1.8%
Maximum60.0%35.7%
Range57.2%33.9%
Mean17.8%14.4%
Median15.2%15.0%
Interquartile 25% (IQ1)11.5%10.8%
Interquartile 75% (IQ3)20.6%17.7%
Interquartile Range (IQR)9.1%7.0%
Standard Deviation (Sample)10.3%5.8%
Standard Deviation (Population)10.2%5.8%

Similar Demographics by Single Father Poverty

Demographics Similar to Immigrants from Nicaragua by Single Father Poverty

In terms of single father poverty, the demographic groups most similar to Immigrants from Nicaragua are Immigrants from Jordan (16.2%, a difference of 0.090%), Mexican (16.1%, a difference of 0.12%), Immigrants from Zimbabwe (16.1%, a difference of 0.22%), Immigrants from Israel (16.1%, a difference of 0.22%), and Immigrants from Czechoslovakia (16.2%, a difference of 0.25%).
DemographicsRating | RankSingle Father Poverty
Nigerians
76.8
/100
|
#148
Good
16.1%
South Africans
75.1
/100
|
#149
Good
16.1%
Jordanians
74.2
/100
|
#150
Good
16.1%
Immigrants | France
73.1
/100
|
#151
Good
16.1%
Immigrants | Zimbabwe
72.1
/100
|
#152
Good
16.1%
Immigrants | Israel
72.0
/100
|
#153
Good
16.1%
Mexicans
70.1
/100
|
#154
Good
16.1%
Immigrants | Nicaragua
67.8
/100
|
#155
Good
16.2%
Immigrants | Jordan
66.0
/100
|
#156
Good
16.2%
Immigrants | Czechoslovakia
62.8
/100
|
#157
Good
16.2%
Portuguese
62.3
/100
|
#158
Good
16.2%
Belizeans
59.9
/100
|
#159
Average
16.2%
Immigrants | Sudan
59.8
/100
|
#160
Average
16.2%
Estonians
56.7
/100
|
#161
Average
16.2%
Ugandans
55.9
/100
|
#162
Average
16.3%

Demographics Similar to Salvadorans by Single Father Poverty

In terms of single father poverty, the demographic groups most similar to Salvadorans are Immigrants from Somalia (14.9%, a difference of 0.16%), Immigrants from Cambodia (14.9%, a difference of 0.28%), Immigrants from China (14.9%, a difference of 0.31%), Malaysian (14.9%, a difference of 0.32%), and Immigrants from Eastern Asia (15.0%, a difference of 0.47%).
DemographicsRating | RankSingle Father Poverty
Immigrants | Eastern Africa
100.0
/100
|
#37
Exceptional
14.7%
Bolivians
100.0
/100
|
#38
Exceptional
14.7%
Immigrants | Asia
100.0
/100
|
#39
Exceptional
14.7%
Pima
100.0
/100
|
#40
Exceptional
14.8%
Indians (Asian)
100.0
/100
|
#41
Exceptional
14.8%
Immigrants | Nepal
100.0
/100
|
#42
Exceptional
14.8%
Immigrants | Eritrea
100.0
/100
|
#43
Exceptional
14.8%
Salvadorans
100.0
/100
|
#44
Exceptional
14.9%
Immigrants | Somalia
100.0
/100
|
#45
Exceptional
14.9%
Immigrants | Cambodia
99.9
/100
|
#46
Exceptional
14.9%
Immigrants | China
99.9
/100
|
#47
Exceptional
14.9%
Malaysians
99.9
/100
|
#48
Exceptional
14.9%
Immigrants | Eastern Asia
99.9
/100
|
#49
Exceptional
15.0%
Bhutanese
99.9
/100
|
#50
Exceptional
15.0%
Immigrants | Pakistan
99.9
/100
|
#51
Exceptional
15.0%