Immigrants from Nicaragua vs Immigrants from Poland Single Male Poverty
COMPARE
Immigrants from Nicaragua
Immigrants from Poland
Single Male Poverty
Single Male Poverty Comparison
Immigrants from Nicaragua
Immigrants from Poland
12.5%
SINGLE MALE POVERTY
84.8/ 100
METRIC RATING
130th/ 347
METRIC RANK
11.5%
SINGLE MALE POVERTY
99.9/ 100
METRIC RATING
45th/ 347
METRIC RANK
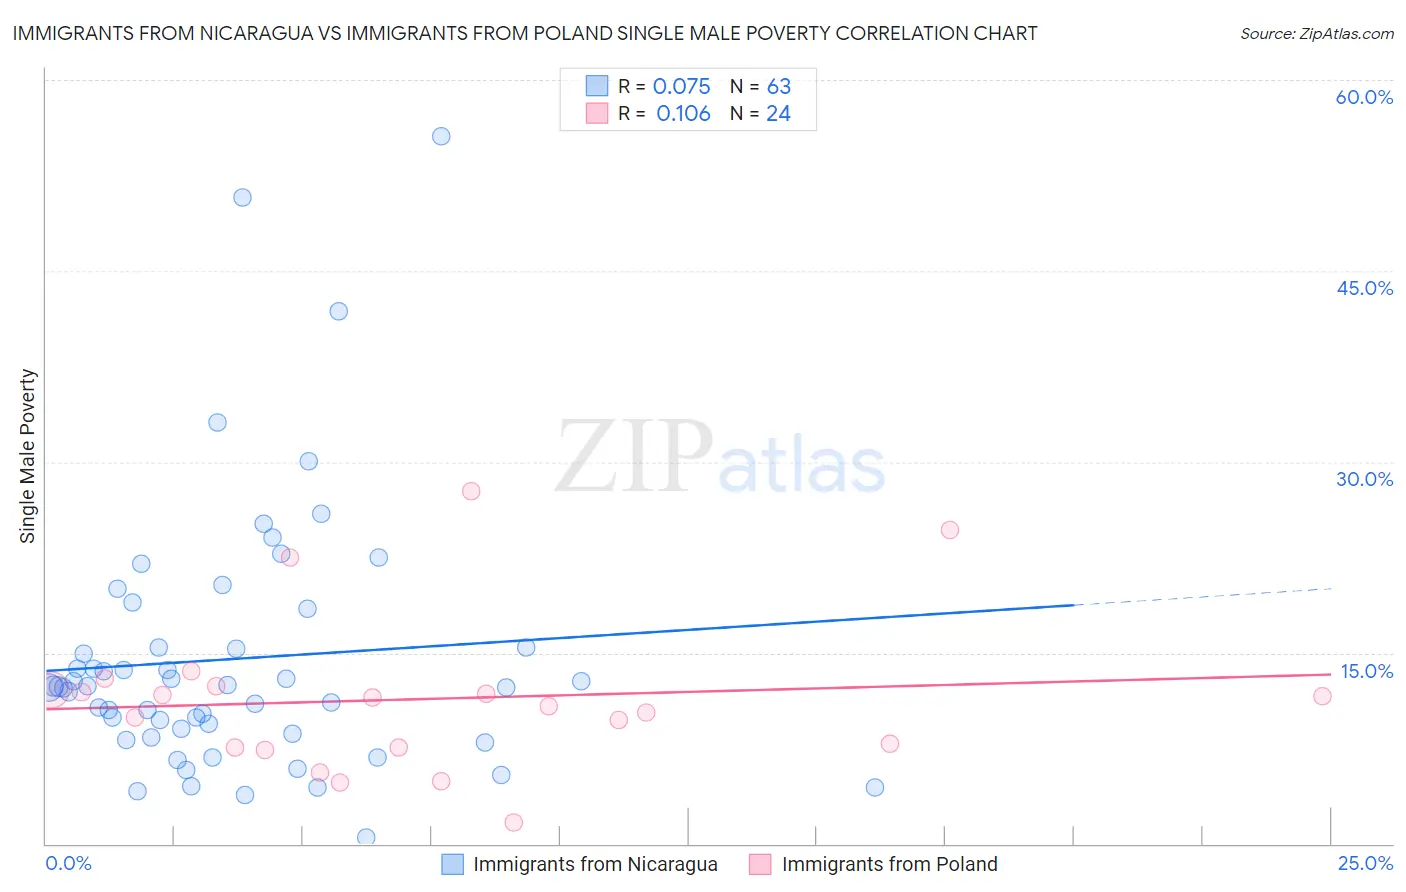
Immigrants from Nicaragua vs Immigrants from Poland Single Male Poverty Correlation Chart
The statistical analysis conducted on geographies consisting of 222,038,180 people shows a slight positive correlation between the proportion of Immigrants from Nicaragua and poverty level among single males in the United States with a correlation coefficient (R) of 0.075 and weighted average of 12.5%. Similarly, the statistical analysis conducted on geographies consisting of 269,525,262 people shows a poor positive correlation between the proportion of Immigrants from Poland and poverty level among single males in the United States with a correlation coefficient (R) of 0.106 and weighted average of 11.5%, a difference of 8.3%.
Single Male Poverty Correlation Summary
| Measurement | Immigrants from Nicaragua | Immigrants from Poland |
| Minimum | 0.49% | 1.6% |
| Maximum | 55.6% | 27.7% |
| Range | 55.1% | 26.1% |
| Mean | 14.5% | 11.4% |
| Median | 12.3% | 11.1% |
| Interquartile 25% (IQ1) | 8.6% | 7.6% |
| Interquartile 75% (IQ3) | 15.4% | 12.2% |
| Interquartile Range (IQR) | 6.8% | 4.7% |
| Standard Deviation (Sample) | 10.3% | 6.1% |
| Standard Deviation (Population) | 10.2% | 6.0% |
Similar Demographics by Single Male Poverty
Demographics Similar to Immigrants from Nicaragua by Single Male Poverty
In terms of single male poverty, the demographic groups most similar to Immigrants from Nicaragua are Immigrants from Sierra Leone (12.5%, a difference of 0.080%), Ecuadorian (12.5%, a difference of 0.11%), Immigrants from Northern Europe (12.5%, a difference of 0.11%), Salvadoran (12.5%, a difference of 0.12%), and Immigrants from Western Asia (12.5%, a difference of 0.14%).
| Demographics | Rating | Rank | Single Male Poverty |
| Immigrants | Kenya | 87.6 /100 | #123 | Excellent 12.5% |
| Russians | 87.3 /100 | #124 | Excellent 12.5% |
| Immigrants | Jordan | 87.1 /100 | #125 | Excellent 12.5% |
| Romanians | 86.4 /100 | #126 | Excellent 12.5% |
| Immigrants | Netherlands | 86.2 /100 | #127 | Excellent 12.5% |
| Ecuadorians | 85.9 /100 | #128 | Excellent 12.5% |
| Immigrants | Sierra Leone | 85.5 /100 | #129 | Excellent 12.5% |
| Immigrants | Nicaragua | 84.8 /100 | #130 | Excellent 12.5% |
| Immigrants | Northern Europe | 83.7 /100 | #131 | Excellent 12.5% |
| Salvadorans | 83.7 /100 | #132 | Excellent 12.5% |
| Immigrants | Western Asia | 83.4 /100 | #133 | Excellent 12.5% |
| Immigrants | Ecuador | 82.1 /100 | #134 | Excellent 12.5% |
| Immigrants | Costa Rica | 81.9 /100 | #135 | Excellent 12.5% |
| Immigrants | Austria | 81.9 /100 | #136 | Excellent 12.5% |
| Ukrainians | 80.7 /100 | #137 | Excellent 12.6% |
Demographics Similar to Immigrants from Poland by Single Male Poverty
In terms of single male poverty, the demographic groups most similar to Immigrants from Poland are Immigrants from Cameroon (11.5%, a difference of 0.020%), Immigrants from Peru (11.5%, a difference of 0.030%), Immigrants from Bulgaria (11.6%, a difference of 0.13%), Egyptian (11.5%, a difference of 0.18%), and Immigrants from Iraq (11.5%, a difference of 0.23%).
| Demographics | Rating | Rank | Single Male Poverty |
| Sri Lankans | 100.0 /100 | #38 | Exceptional 11.5% |
| Soviet Union | 100.0 /100 | #39 | Exceptional 11.5% |
| Immigrants | Korea | 100.0 /100 | #40 | Exceptional 11.5% |
| Immigrants | Iraq | 99.9 /100 | #41 | Exceptional 11.5% |
| Egyptians | 99.9 /100 | #42 | Exceptional 11.5% |
| Immigrants | Peru | 99.9 /100 | #43 | Exceptional 11.5% |
| Immigrants | Cameroon | 99.9 /100 | #44 | Exceptional 11.5% |
| Immigrants | Poland | 99.9 /100 | #45 | Exceptional 11.5% |
| Immigrants | Bulgaria | 99.9 /100 | #46 | Exceptional 11.6% |
| Nepalese | 99.9 /100 | #47 | Exceptional 11.6% |
| Immigrants | Indonesia | 99.9 /100 | #48 | Exceptional 11.6% |
| Tlingit-Haida | 99.9 /100 | #49 | Exceptional 11.6% |
| Immigrants | Lithuania | 99.9 /100 | #50 | Exceptional 11.6% |
| Paraguayans | 99.9 /100 | #51 | Exceptional 11.6% |
| Samoans | 99.9 /100 | #52 | Exceptional 11.7% |