Immigrants from Morocco vs Spanish American Single Father Poverty
COMPARE
Immigrants from Morocco
Spanish American
Single Father Poverty
Single Father Poverty Comparison
Immigrants from Morocco
Spanish Americans
16.3%
SINGLE FATHER POVERTY
50.7/ 100
METRIC RATING
171st/ 347
METRIC RANK
16.9%
SINGLE FATHER POVERTY
3.7/ 100
METRIC RATING
231st/ 347
METRIC RANK
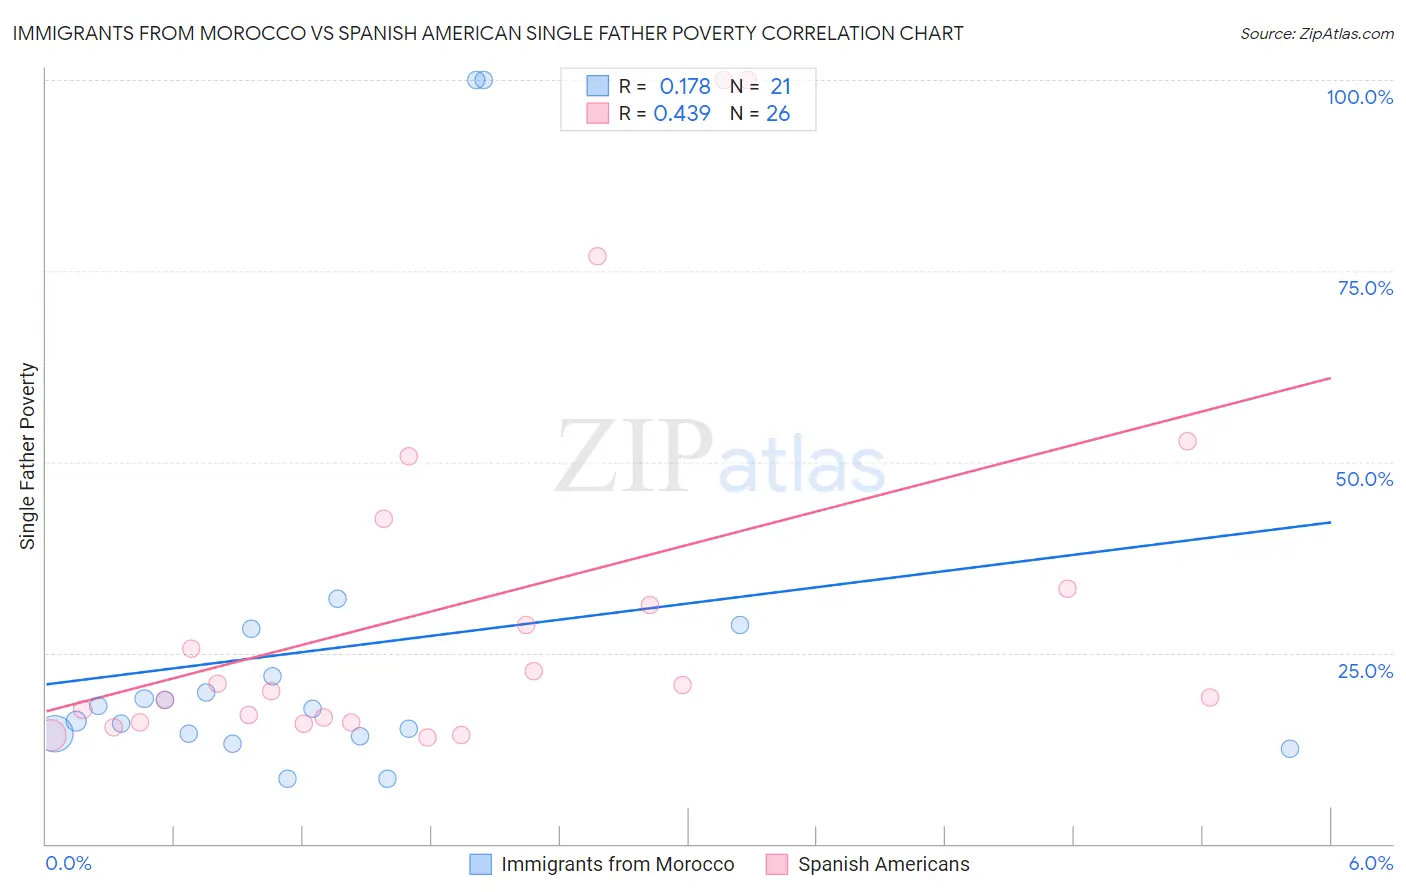
Immigrants from Morocco vs Spanish American Single Father Poverty Correlation Chart
The statistical analysis conducted on geographies consisting of 153,611,026 people shows a poor positive correlation between the proportion of Immigrants from Morocco and poverty level among single fathers in the United States with a correlation coefficient (R) of 0.178 and weighted average of 16.3%. Similarly, the statistical analysis conducted on geographies consisting of 95,172,668 people shows a moderate positive correlation between the proportion of Spanish Americans and poverty level among single fathers in the United States with a correlation coefficient (R) of 0.439 and weighted average of 16.9%, a difference of 3.6%.
Single Father Poverty Correlation Summary
| Measurement | Immigrants from Morocco | Spanish American |
| Minimum | 8.5% | 13.9% |
| Maximum | 100.0% | 100.0% |
| Range | 91.5% | 86.1% |
| Mean | 25.5% | 31.5% |
| Median | 17.7% | 20.4% |
| Interquartile 25% (IQ1) | 14.2% | 15.9% |
| Interquartile 75% (IQ3) | 25.0% | 33.3% |
| Interquartile Range (IQR) | 10.8% | 17.4% |
| Standard Deviation (Sample) | 25.5% | 25.1% |
| Standard Deviation (Population) | 24.9% | 24.6% |
Similar Demographics by Single Father Poverty
Demographics Similar to Immigrants from Morocco by Single Father Poverty
In terms of single father poverty, the demographic groups most similar to Immigrants from Morocco are Immigrants from Sierra Leone (16.3%, a difference of 0.030%), Immigrants from St. Vincent and the Grenadines (16.3%, a difference of 0.030%), Swedish (16.3%, a difference of 0.030%), Immigrants from Ecuador (16.3%, a difference of 0.050%), and Scandinavian (16.3%, a difference of 0.070%).
| Demographics | Rating | Rank | Single Father Poverty |
| Guyanese | 55.2 /100 | #164 | Average 16.3% |
| Immigrants | Bangladesh | 55.1 /100 | #165 | Average 16.3% |
| Immigrants | Europe | 54.8 /100 | #166 | Average 16.3% |
| Yugoslavians | 53.9 /100 | #167 | Average 16.3% |
| Costa Ricans | 53.6 /100 | #168 | Average 16.3% |
| Northern Europeans | 52.8 /100 | #169 | Average 16.3% |
| Scandinavians | 52.3 /100 | #170 | Average 16.3% |
| Immigrants | Morocco | 50.7 /100 | #171 | Average 16.3% |
| Immigrants | Sierra Leone | 50.1 /100 | #172 | Average 16.3% |
| Immigrants | St. Vincent and the Grenadines | 50.0 /100 | #173 | Average 16.3% |
| Swedes | 50.0 /100 | #174 | Average 16.3% |
| Immigrants | Ecuador | 49.7 /100 | #175 | Average 16.3% |
| Vietnamese | 48.0 /100 | #176 | Average 16.3% |
| Immigrants | South Africa | 44.2 /100 | #177 | Average 16.3% |
| Immigrants | Cuba | 41.6 /100 | #178 | Average 16.4% |
Demographics Similar to Spanish Americans by Single Father Poverty
In terms of single father poverty, the demographic groups most similar to Spanish Americans are Immigrants from Grenada (16.9%, a difference of 0.020%), Senegalese (16.9%, a difference of 0.16%), Marshallese (16.9%, a difference of 0.19%), Immigrants from Trinidad and Tobago (16.8%, a difference of 0.21%), and Israeli (16.8%, a difference of 0.24%).
| Demographics | Rating | Rank | Single Father Poverty |
| Immigrants | Norway | 6.5 /100 | #224 | Tragic 16.8% |
| Menominee | 6.4 /100 | #225 | Tragic 16.8% |
| Hispanics or Latinos | 6.1 /100 | #226 | Tragic 16.8% |
| British | 5.6 /100 | #227 | Tragic 16.8% |
| Belgians | 5.3 /100 | #228 | Tragic 16.8% |
| Israelis | 4.6 /100 | #229 | Tragic 16.8% |
| Immigrants | Trinidad and Tobago | 4.5 /100 | #230 | Tragic 16.8% |
| Spanish Americans | 3.7 /100 | #231 | Tragic 16.9% |
| Immigrants | Grenada | 3.7 /100 | #232 | Tragic 16.9% |
| Senegalese | 3.2 /100 | #233 | Tragic 16.9% |
| Marshallese | 3.1 /100 | #234 | Tragic 16.9% |
| Immigrants | Western Europe | 2.9 /100 | #235 | Tragic 16.9% |
| Immigrants | Germany | 2.9 /100 | #236 | Tragic 16.9% |
| Sub-Saharan Africans | 2.9 /100 | #237 | Tragic 16.9% |
| Immigrants | Saudi Arabia | 2.7 /100 | #238 | Tragic 16.9% |