Immigrants from Morocco vs Northern European Child Poverty Among Girls Under 16

COMPARE

Immigrants from Morocco
Race
Ancestry
AfghanAfricanAlaska NativeAlaskan AthabascanAlbanianAleutAlsatianAmericanApacheArabArapahoArgentineanArmenianAssyrian/Chaldean/SyriacAustralianAustrianBahamianBangladeshiBarbadianBasqueBelgianBelizeanBermudanBhutaneseBlackfeetBolivianBrazilianBritishBritish West IndianBulgarianBurmeseCajunCambodianCanadianCape VerdeanCarpatho RusynCelticCentral AmericanCentral American IndianCherokeeCheyenneChickasawChileanChineseChippewaChoctawColombianColvilleComancheCosta RicanCreeCreekCroatianCrowCubanCypriotCzechCzechoslovakianDanishDelawareDominicanDutchDutch West IndianEastern EuropeanEcuadorianEgyptianEnglishEstonianEthiopianEuropeanFijianFilipinoFinnishFrenchFrench American IndianFrench CanadianGermanGerman RussianGhanaianGreekGuamanian/ChamorroGuatemalanGuyaneseHaitianHmongHonduranHopiHoumaHungarianIcelanderIndian (Asian)IndonesianInupiatIranianIraqiIrishIroquoisIsraeliItalianJamaicanJapaneseJordanianKenyanKiowaKoreanLaotianLatvianLebaneseLiberianLithuanianLumbeeLuxembourgerMacedonianMalaysianMalteseMarshalleseMenomineeMexicanMexican American IndianMongolianMoroccanNative HawaiianNavajoNepaleseNew ZealanderNicaraguanNigerianNorwegianOkinawanOsageOttawaPaiutePakistaniPalestinianPanamanianParaguayanPennsylvania GermanPeruvianPimaPolishPortuguesePotawatomiPuebloPuerto RicanPuget Sound SalishRomanianRussianSalvadoranSamoanScandinavianScotch-IrishScottishSeminoleSenegaleseSerbianShoshoneSierra LeoneanSiouxSlavicSlovakSloveneSomaliSouth AfricanSouth AmericanSouth American IndianSoviet UnionSpaniardSpanishSpanish AmericanSpanish American IndianSri LankanSubsaharan AfricanSudaneseSwedishSwissSyrianTaiwaneseThaiTlingit-HaidaTohono O'OdhamTonganTrinidadian and TobagonianTsimshianTurkishU.S. Virgin IslanderUgandanUkrainianUruguayanUteVenezuelanVietnameseWelshWest IndianYakamaYaquiYugoslavianYumanYup'ikZimbabwean
Immigration
NonimmigrantsImmigrantsAfghanistanAfricaAlbaniaArgentinaArmeniaAsiaAustraliaAustriaBahamasBangladeshBarbadosBelarusBelgiumBelizeBoliviaBosnia and HerzegovinaBrazilBulgariaBurma/MyanmarCabo VerdeCambodiaCameroonCanadaCaribbeanCentral AmericaChileChinaColombiaCongoCosta RicaCroatiaCubaCzechoslovakiaDenmarkDominicaDominican RepublicEastern AfricaEastern AsiaEastern EuropeEcuadorEgyptEl SalvadorEnglandEritreaEthiopiaEuropeFijiFranceGermanyGhanaGreeceGrenadaGuatemalaGuyanaHaitiHondurasHong KongHungaryIndiaIndonesiaIranIraqIrelandIsraelItalyJamaicaJapanJordanKazakhstanKenyaKoreaKuwaitLaosLatin AmericaLatviaLebanonLiberiaLithuaniaMalaysiaMexicoMicronesiaMiddle AfricaMoldovaMoroccoNepalNetherlandsNicaraguaNigeriaNorth AmericaNorth MacedoniaNorthern AfricaNorthern EuropeNorwayOceaniaPakistanPanamaPeruPhilippinesPolandPortugalRomaniaRussiaSaudi ArabiaScotlandSenegalSerbiaSierra LeoneSingaporeSomaliaSouth AfricaSouth AmericaSouth Central AsiaSouth Eastern AsiaSouthern EuropeSpainSri LankaSt. Vincent and the GrenadinesSudanSwedenSwitzerlandSyriaTaiwanThailandTrinidad and TobagoTurkeyUgandaUkraineUruguayUzbekistanVenezuelaVietnamWest IndiesWestern AfricaWestern AsiaWestern EuropeYemenZaireZimbabweAzores
Northern European
Race
Ancestry
AfghanAfricanAlaska NativeAlaskan AthabascanAlbanianAleutAlsatianAmericanApacheArabArapahoArgentineanArmenianAssyrian/Chaldean/SyriacAustralianAustrianBahamianBangladeshiBarbadianBasqueBelgianBelizeanBermudanBhutaneseBlackfeetBolivianBrazilianBritishBritish West IndianBulgarianBurmeseCajunCambodianCanadianCape VerdeanCarpatho RusynCelticCentral AmericanCentral American IndianCherokeeCheyenneChickasawChileanChineseChippewaChoctawColombianColvilleComancheCosta RicanCreeCreekCroatianCrowCubanCypriotCzechCzechoslovakianDanishDelawareDominicanDutchDutch West IndianEastern EuropeanEcuadorianEgyptianEnglishEstonianEthiopianEuropeanFijianFilipinoFinnishFrenchFrench American IndianFrench CanadianGermanGerman RussianGhanaianGreekGuamanian/ChamorroGuatemalanGuyaneseHaitianHmongHonduranHopiHoumaHungarianIcelanderIndian (Asian)IndonesianInupiatIranianIraqiIrishIroquoisIsraeliItalianJamaicanJapaneseJordanianKenyanKiowaKoreanLaotianLatvianLebaneseLiberianLithuanianLumbeeLuxembourgerMacedonianMalaysianMalteseMarshalleseMenomineeMexicanMexican American IndianMongolianMoroccanNative HawaiianNavajoNepaleseNew ZealanderNicaraguanNigerianNorthern EuropeanNorwegianOkinawanOsageOttawaPaiutePakistaniPalestinianPanamanianParaguayanPennsylvania GermanPeruvianPimaPolishPortuguesePotawatomiPuebloPuerto RicanPuget Sound SalishRomanianRussianSalvadoranSamoanScandinavianScotch-IrishScottishSeminoleSenegaleseSerbianShoshoneSierra LeoneanSiouxSlavicSlovakSloveneSomaliSouth AfricanSouth AmericanSouth American IndianSoviet UnionSpaniardSpanishSpanish AmericanSpanish American IndianSri LankanSubsaharan AfricanSudaneseSwedishSwissSyrianTaiwaneseThaiTlingit-HaidaTohono O'OdhamTonganTrinidadian and TobagonianTsimshianTurkishU.S. Virgin IslanderUgandanUkrainianUruguayanUteVenezuelanVietnameseWelshWest IndianYakamaYaquiYugoslavianYumanYup'ikZimbabwean
Immigration
NonimmigrantsImmigrantsAfghanistanAfricaAlbaniaArgentinaArmeniaAsiaAustraliaAustriaBahamasBangladeshBarbadosBelarusBelgiumBelizeBoliviaBosnia and HerzegovinaBrazilBulgariaBurma/MyanmarCabo VerdeCambodiaCameroonCanadaCaribbeanCentral AmericaChileChinaColombiaCongoCosta RicaCroatiaCubaCzechoslovakiaDenmarkDominicaDominican RepublicEastern AfricaEastern AsiaEastern EuropeEcuadorEgyptEl SalvadorEnglandEritreaEthiopiaEuropeFijiFranceGermanyGhanaGreeceGrenadaGuatemalaGuyanaHaitiHondurasHong KongHungaryIndiaIndonesiaIranIraqIrelandIsraelItalyJamaicaJapanJordanKazakhstanKenyaKoreaKuwaitLaosLatin AmericaLatviaLebanonLiberiaLithuaniaMalaysiaMexicoMicronesiaMiddle AfricaMoldovaNepalNetherlandsNicaraguaNigeriaNorth AmericaNorth MacedoniaNorthern AfricaNorthern EuropeNorwayOceaniaPakistanPanamaPeruPhilippinesPolandPortugalRomaniaRussiaSaudi ArabiaScotlandSenegalSerbiaSierra LeoneSingaporeSomaliaSouth AfricaSouth AmericaSouth Central AsiaSouth Eastern AsiaSouthern EuropeSpainSri LankaSt. Vincent and the GrenadinesSudanSwedenSwitzerlandSyriaTaiwanThailandTrinidad and TobagoTurkeyUgandaUkraineUruguayUzbekistanVenezuelaVietnamWest IndiesWestern AfricaWestern AsiaWestern EuropeYemenZaireZimbabweAzores
Child Poverty Among Girls Under 16
Income
Poverty
Unemployment
Labor Participation
Family Structure
Vehicle Availability
Education Level
Disability

Child Poverty Among Girls Under 16 Comparison

Immigrants from Morocco

Northern Europeans

Fair
Exceptional
16.8%
CHILD POVERTY AMONG GIRLS UNDER 16
34.6/ 100
METRIC RATING
187th/ 347
METRIC RANK
14.8%
CHILD POVERTY AMONG GIRLS UNDER 16
97.0/ 100
METRIC RATING
90th/ 347
METRIC RANK

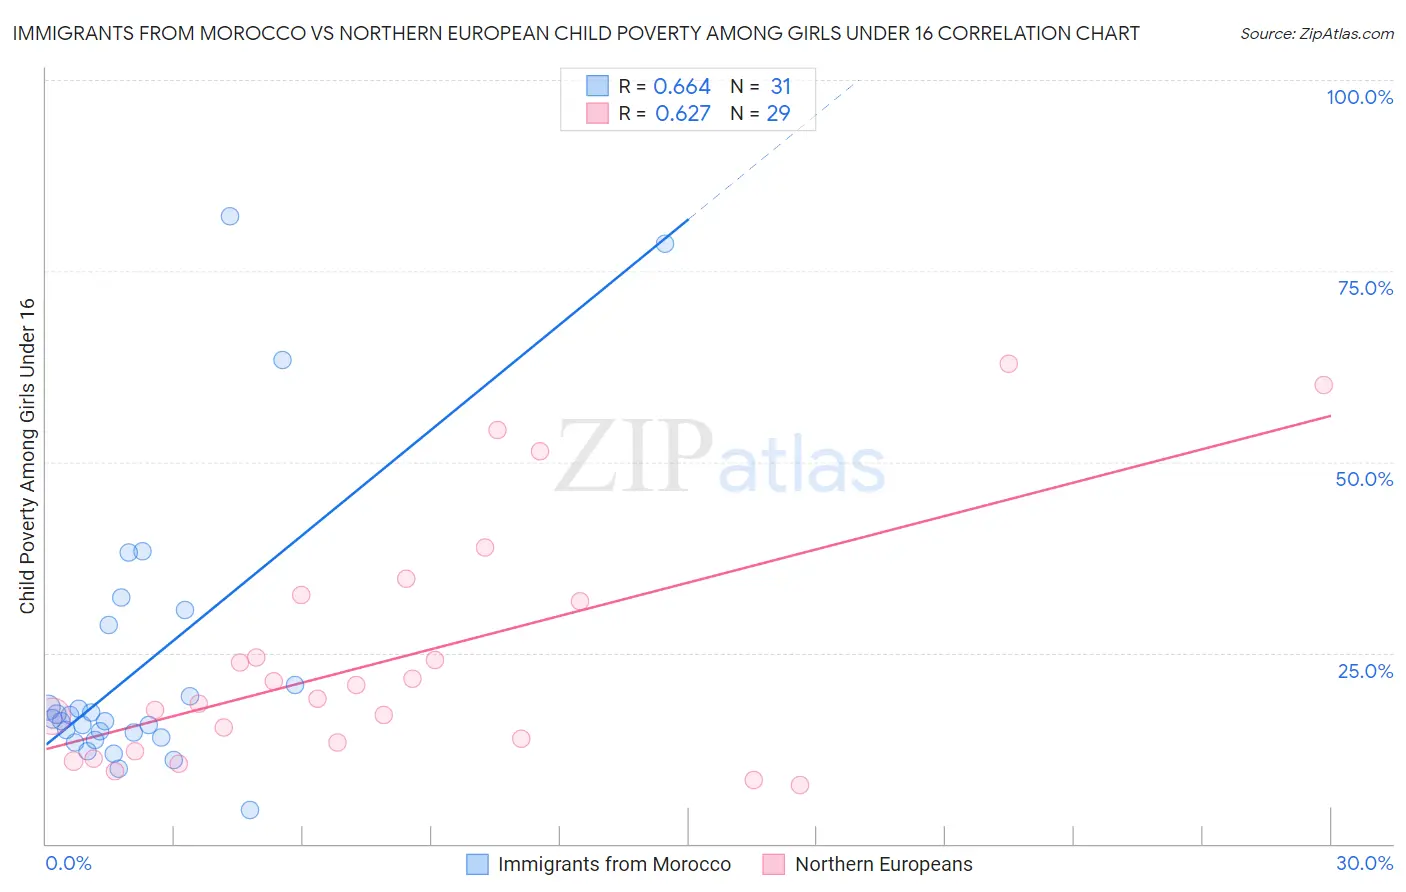
Immigrants from Morocco vs Northern European Child Poverty Among Girls Under 16 Correlation Chart

The statistical analysis conducted on geographies consisting of 177,633,754 people shows a significant positive correlation between the proportion of Immigrants from Morocco and poverty level among girls under the age of 16 in the United States with a correlation coefficient (R) of 0.664 and weighted average of 16.8%. Similarly, the statistical analysis conducted on geographies consisting of 396,909,088 people shows a significant positive correlation between the proportion of Northern Europeans and poverty level among girls under the age of 16 in the United States with a correlation coefficient (R) of 0.627 and weighted average of 14.8%, a difference of 13.2%.
Immigrants from Morocco vs Northern European Child Poverty Among Girls Under 16

Child Poverty Among Girls Under 16 Correlation Summary

MeasurementImmigrants from MoroccoNorthern European
Minimum4.5%7.8%
Maximum82.2%62.9%
Range77.7%55.1%
Mean23.6%24.2%
Median16.3%19.0%
Interquartile 25% (IQ1)14.0%12.7%
Interquartile 75% (IQ3)28.7%32.2%
Interquartile Range (IQR)14.7%19.5%
Standard Deviation (Sample)18.9%15.6%
Standard Deviation (Population)18.5%15.4%

Similar Demographics by Child Poverty Among Girls Under 16

Demographics Similar to Immigrants from Morocco by Child Poverty Among Girls Under 16

In terms of child poverty among girls under 16, the demographic groups most similar to Immigrants from Morocco are Arab (16.8%, a difference of 0.010%), South American Indian (16.8%, a difference of 0.050%), Immigrants from Uruguay (16.7%, a difference of 0.13%), Immigrants from Bosnia and Herzegovina (16.8%, a difference of 0.26%), and Kenyan (16.8%, a difference of 0.29%).
DemographicsRating | RankChild Poverty Among Girls Under 16
Immigrants | Syria
43.3
/100
|
#180
Average
16.6%
Immigrants | Iraq
43.2
/100
|
#181
Average
16.6%
Immigrants | Ethiopia
43.1
/100
|
#182
Average
16.6%
Immigrants | Portugal
42.5
/100
|
#183
Average
16.6%
Scotch-Irish
39.6
/100
|
#184
Fair
16.7%
Immigrants | Uruguay
35.6
/100
|
#185
Fair
16.7%
South American Indians
35.0
/100
|
#186
Fair
16.8%
Immigrants | Morocco
34.6
/100
|
#187
Fair
16.8%
Arabs
34.5
/100
|
#188
Fair
16.8%
Immigrants | Bosnia and Herzegovina
32.5
/100
|
#189
Fair
16.8%
Kenyans
32.3
/100
|
#190
Fair
16.8%
Immigrants | Azores
31.3
/100
|
#191
Fair
16.8%
Immigrants | Uganda
31.3
/100
|
#192
Fair
16.8%
Aleuts
28.7
/100
|
#193
Fair
16.9%
Spanish
28.6
/100
|
#194
Fair
16.9%

Demographics Similar to Northern Europeans by Child Poverty Among Girls Under 16

In terms of child poverty among girls under 16, the demographic groups most similar to Northern Europeans are Jordanian (14.8%, a difference of 0.020%), Immigrants from Belarus (14.8%, a difference of 0.040%), Immigrants from Canada (14.8%, a difference of 0.070%), Finnish (14.8%, a difference of 0.14%), and Australian (14.8%, a difference of 0.16%).
DemographicsRating | RankChild Poverty Among Girls Under 16
Immigrants | Italy
97.4
/100
|
#83
Exceptional
14.8%
Soviet Union
97.3
/100
|
#84
Exceptional
14.8%
Swiss
97.2
/100
|
#85
Exceptional
14.8%
Australians
97.2
/100
|
#86
Exceptional
14.8%
Finns
97.2
/100
|
#87
Exceptional
14.8%
Immigrants | Canada
97.1
/100
|
#88
Exceptional
14.8%
Jordanians
97.1
/100
|
#89
Exceptional
14.8%
Northern Europeans
97.0
/100
|
#90
Exceptional
14.8%
Immigrants | Belarus
97.0
/100
|
#91
Exceptional
14.8%
Austrians
96.7
/100
|
#92
Exceptional
14.9%
Immigrants | North America
96.6
/100
|
#93
Exceptional
14.9%
Immigrants | Switzerland
96.3
/100
|
#94
Exceptional
14.9%
Germans
96.3
/100
|
#95
Exceptional
14.9%
Immigrants | France
96.2
/100
|
#96
Exceptional
14.9%
Immigrants | Latvia
96.1
/100
|
#97
Exceptional
14.9%