Immigrants from Morocco vs Italian Male Poverty
COMPARE
Immigrants from Morocco
Italian
Male Poverty
Male Poverty Comparison
Immigrants from Morocco
Italians
11.3%
MALE POVERTY
40.1/ 100
METRIC RATING
180th/ 347
METRIC RANK
9.6%
MALE POVERTY
99.7/ 100
METRIC RATING
23rd/ 347
METRIC RANK
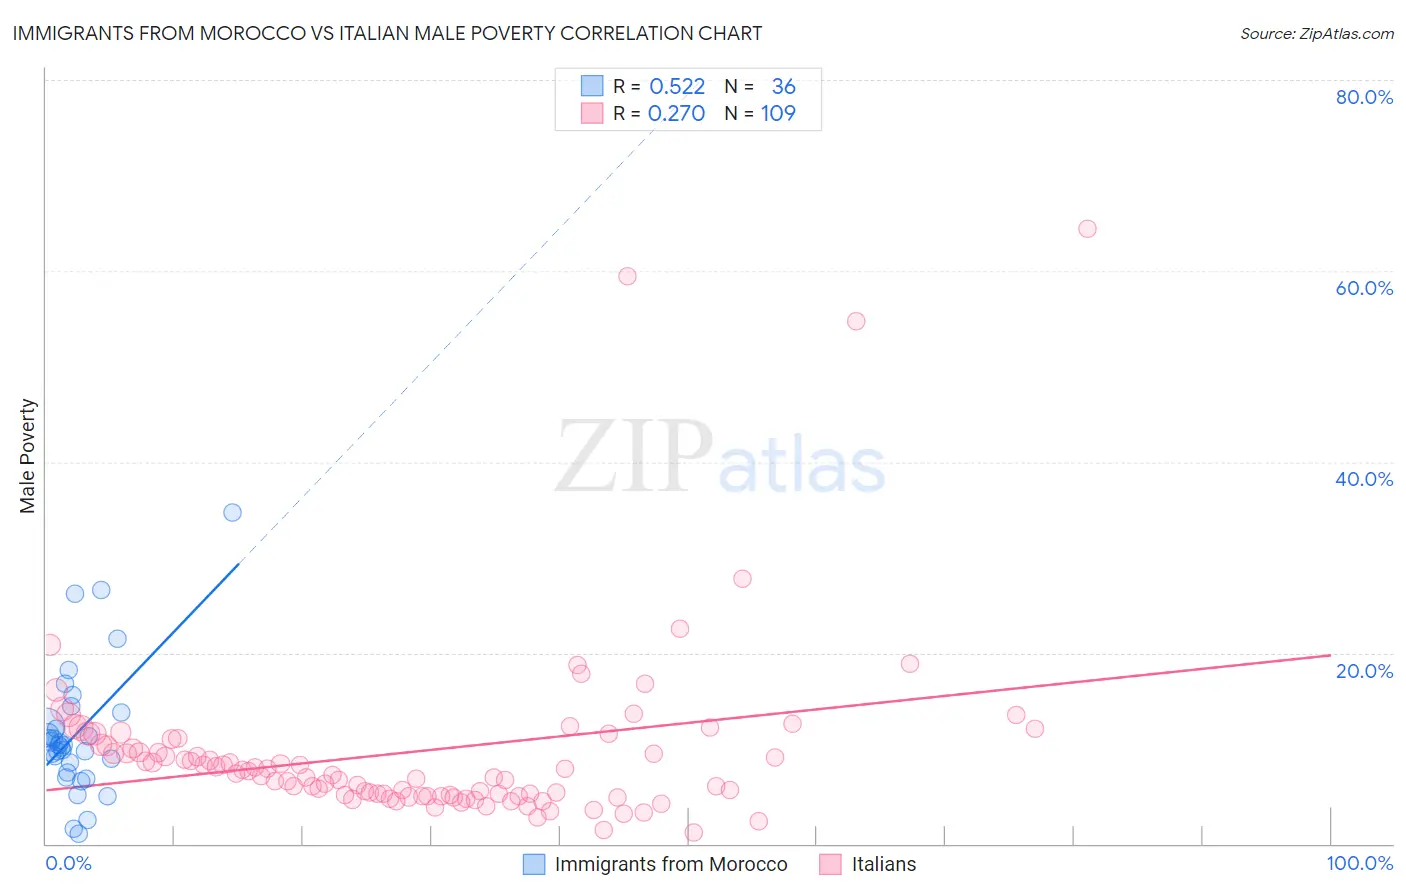
Immigrants from Morocco vs Italian Male Poverty Correlation Chart
The statistical analysis conducted on geographies consisting of 178,894,090 people shows a substantial positive correlation between the proportion of Immigrants from Morocco and poverty level among males in the United States with a correlation coefficient (R) of 0.522 and weighted average of 11.3%. Similarly, the statistical analysis conducted on geographies consisting of 573,221,501 people shows a weak positive correlation between the proportion of Italians and poverty level among males in the United States with a correlation coefficient (R) of 0.270 and weighted average of 9.6%, a difference of 17.4%.
Male Poverty Correlation Summary
| Measurement | Immigrants from Morocco | Italian |
| Minimum | 1.1% | 1.2% |
| Maximum | 34.7% | 64.4% |
| Range | 33.6% | 63.1% |
| Mean | 11.6% | 9.6% |
| Median | 10.4% | 7.3% |
| Interquartile 25% (IQ1) | 8.0% | 5.1% |
| Interquartile 75% (IQ3) | 13.0% | 10.7% |
| Interquartile Range (IQR) | 5.1% | 5.6% |
| Standard Deviation (Sample) | 6.9% | 9.6% |
| Standard Deviation (Population) | 6.8% | 9.5% |
Similar Demographics by Male Poverty
Demographics Similar to Immigrants from Morocco by Male Poverty
In terms of male poverty, the demographic groups most similar to Immigrants from Morocco are Immigrants from Syria (11.3%, a difference of 0.010%), Immigrants from Costa Rica (11.3%, a difference of 0.060%), Mongolian (11.3%, a difference of 0.11%), Kenyan (11.3%, a difference of 0.17%), and Immigrants from South America (11.3%, a difference of 0.33%).
| Demographics | Rating | Rank | Male Poverty |
| Pennsylvania Germans | 50.5 /100 | #173 | Average 11.2% |
| Immigrants | Oceania | 50.0 /100 | #174 | Average 11.2% |
| Celtics | 47.5 /100 | #175 | Average 11.2% |
| Immigrants | Fiji | 46.0 /100 | #176 | Average 11.2% |
| Lebanese | 45.6 /100 | #177 | Average 11.2% |
| Immigrants | Cameroon | 44.5 /100 | #178 | Average 11.2% |
| Immigrants | Syria | 40.3 /100 | #179 | Average 11.3% |
| Immigrants | Morocco | 40.1 /100 | #180 | Average 11.3% |
| Immigrants | Costa Rica | 39.5 /100 | #181 | Fair 11.3% |
| Mongolians | 39.0 /100 | #182 | Fair 11.3% |
| Kenyans | 38.4 /100 | #183 | Fair 11.3% |
| Immigrants | South America | 36.9 /100 | #184 | Fair 11.3% |
| Immigrants | Afghanistan | 33.3 /100 | #185 | Fair 11.4% |
| Immigrants | Sierra Leone | 32.9 /100 | #186 | Fair 11.4% |
| Immigrants | Iraq | 31.9 /100 | #187 | Fair 11.4% |
Demographics Similar to Italians by Male Poverty
In terms of male poverty, the demographic groups most similar to Italians are Croatian (9.6%, a difference of 0.010%), Swedish (9.6%, a difference of 0.080%), Eastern European (9.6%, a difference of 0.22%), Immigrants from Scotland (9.6%, a difference of 0.26%), and Latvian (9.6%, a difference of 0.52%).
| Demographics | Rating | Rank | Male Poverty |
| Luxembourgers | 99.8 /100 | #16 | Exceptional 9.5% |
| Norwegians | 99.8 /100 | #17 | Exceptional 9.5% |
| Lithuanians | 99.8 /100 | #18 | Exceptional 9.5% |
| Immigrants | Hong Kong | 99.7 /100 | #19 | Exceptional 9.6% |
| Latvians | 99.7 /100 | #20 | Exceptional 9.6% |
| Immigrants | Scotland | 99.7 /100 | #21 | Exceptional 9.6% |
| Croatians | 99.7 /100 | #22 | Exceptional 9.6% |
| Italians | 99.7 /100 | #23 | Exceptional 9.6% |
| Swedes | 99.7 /100 | #24 | Exceptional 9.6% |
| Eastern Europeans | 99.6 /100 | #25 | Exceptional 9.6% |
| Burmese | 99.6 /100 | #26 | Exceptional 9.7% |
| Danes | 99.6 /100 | #27 | Exceptional 9.7% |
| Immigrants | Korea | 99.6 /100 | #28 | Exceptional 9.7% |
| Greeks | 99.6 /100 | #29 | Exceptional 9.7% |
| Poles | 99.5 /100 | #30 | Exceptional 9.7% |