Immigrants from Moldova vs Immigrants from Caribbean Child Poverty Among Girls Under 16

COMPARE

Immigrants from Moldova
Race
Ancestry
AfghanAfricanAlaska NativeAlaskan AthabascanAlbanianAleutAlsatianAmericanApacheArabArapahoArgentineanArmenianAssyrian/Chaldean/SyriacAustralianAustrianBahamianBangladeshiBarbadianBasqueBelgianBelizeanBermudanBhutaneseBlackfeetBolivianBrazilianBritishBritish West IndianBulgarianBurmeseCajunCambodianCanadianCape VerdeanCarpatho RusynCelticCentral AmericanCentral American IndianCherokeeCheyenneChickasawChileanChineseChippewaChoctawColombianColvilleComancheCosta RicanCreeCreekCroatianCrowCubanCypriotCzechCzechoslovakianDanishDelawareDominicanDutchDutch West IndianEastern EuropeanEcuadorianEgyptianEnglishEstonianEthiopianEuropeanFijianFilipinoFinnishFrenchFrench American IndianFrench CanadianGermanGerman RussianGhanaianGreekGuamanian/ChamorroGuatemalanGuyaneseHaitianHmongHonduranHopiHoumaHungarianIcelanderIndian (Asian)IndonesianInupiatIranianIraqiIrishIroquoisIsraeliItalianJamaicanJapaneseJordanianKenyanKiowaKoreanLaotianLatvianLebaneseLiberianLithuanianLumbeeLuxembourgerMacedonianMalaysianMalteseMarshalleseMenomineeMexicanMexican American IndianMongolianMoroccanNative HawaiianNavajoNepaleseNew ZealanderNicaraguanNigerianNorthern EuropeanNorwegianOkinawanOsageOttawaPaiutePakistaniPalestinianPanamanianParaguayanPennsylvania GermanPeruvianPimaPolishPortuguesePotawatomiPuebloPuerto RicanPuget Sound SalishRomanianRussianSalvadoranSamoanScandinavianScotch-IrishScottishSeminoleSenegaleseSerbianShoshoneSierra LeoneanSiouxSlavicSlovakSloveneSomaliSouth AfricanSouth AmericanSouth American IndianSoviet UnionSpaniardSpanishSpanish AmericanSpanish American IndianSri LankanSubsaharan AfricanSudaneseSwedishSwissSyrianTaiwaneseThaiTlingit-HaidaTohono O'OdhamTonganTrinidadian and TobagonianTsimshianTurkishU.S. Virgin IslanderUgandanUkrainianUruguayanUteVenezuelanVietnameseWelshWest IndianYakamaYaquiYugoslavianYumanYup'ikZimbabwean
Immigration
NonimmigrantsImmigrantsAfghanistanAfricaAlbaniaArgentinaArmeniaAsiaAustraliaAustriaBahamasBangladeshBarbadosBelarusBelgiumBelizeBoliviaBosnia and HerzegovinaBrazilBulgariaBurma/MyanmarCabo VerdeCambodiaCameroonCanadaCentral AmericaChileChinaColombiaCongoCosta RicaCroatiaCubaCzechoslovakiaDenmarkDominicaDominican RepublicEastern AfricaEastern AsiaEastern EuropeEcuadorEgyptEl SalvadorEnglandEritreaEthiopiaEuropeFijiFranceGermanyGhanaGreeceGrenadaGuatemalaGuyanaHaitiHondurasHong KongHungaryIndiaIndonesiaIranIraqIrelandIsraelItalyJamaicaJapanJordanKazakhstanKenyaKoreaKuwaitLaosLatin AmericaLatviaLebanonLiberiaLithuaniaMalaysiaMexicoMicronesiaMiddle AfricaMoldovaMoroccoNepalNetherlandsNicaraguaNigeriaNorth AmericaNorth MacedoniaNorthern AfricaNorthern EuropeNorwayOceaniaPakistanPanamaPeruPhilippinesPolandPortugalRomaniaRussiaSaudi ArabiaScotlandSenegalSerbiaSierra LeoneSingaporeSomaliaSouth AfricaSouth AmericaSouth Central AsiaSouth Eastern AsiaSouthern EuropeSpainSri LankaSt. Vincent and the GrenadinesSudanSwedenSwitzerlandSyriaTaiwanThailandTrinidad and TobagoTurkeyUgandaUkraineUruguayUzbekistanVenezuelaVietnamWest IndiesWestern AfricaWestern AsiaWestern EuropeYemenZaireZimbabweAzores
Immigrants from Caribbean
Race
Ancestry
AfghanAfricanAlaska NativeAlaskan AthabascanAlbanianAleutAlsatianAmericanApacheArabArapahoArgentineanArmenianAssyrian/Chaldean/SyriacAustralianAustrianBahamianBangladeshiBarbadianBasqueBelgianBelizeanBermudanBhutaneseBlackfeetBolivianBrazilianBritishBritish West IndianBulgarianBurmeseCajunCambodianCanadianCape VerdeanCarpatho RusynCelticCentral AmericanCentral American IndianCherokeeCheyenneChickasawChileanChineseChippewaChoctawColombianColvilleComancheCosta RicanCreeCreekCroatianCrowCubanCypriotCzechCzechoslovakianDanishDelawareDominicanDutchDutch West IndianEastern EuropeanEcuadorianEgyptianEnglishEstonianEthiopianEuropeanFijianFilipinoFinnishFrenchFrench American IndianFrench CanadianGermanGerman RussianGhanaianGreekGuamanian/ChamorroGuatemalanGuyaneseHaitianHmongHonduranHopiHoumaHungarianIcelanderIndian (Asian)IndonesianInupiatIranianIraqiIrishIroquoisIsraeliItalianJamaicanJapaneseJordanianKenyanKiowaKoreanLaotianLatvianLebaneseLiberianLithuanianLumbeeLuxembourgerMacedonianMalaysianMalteseMarshalleseMenomineeMexicanMexican American IndianMongolianMoroccanNative HawaiianNavajoNepaleseNew ZealanderNicaraguanNigerianNorthern EuropeanNorwegianOkinawanOsageOttawaPaiutePakistaniPalestinianPanamanianParaguayanPennsylvania GermanPeruvianPimaPolishPortuguesePotawatomiPuebloPuerto RicanPuget Sound SalishRomanianRussianSalvadoranSamoanScandinavianScotch-IrishScottishSeminoleSenegaleseSerbianShoshoneSierra LeoneanSiouxSlavicSlovakSloveneSomaliSouth AfricanSouth AmericanSouth American IndianSoviet UnionSpaniardSpanishSpanish AmericanSpanish American IndianSri LankanSubsaharan AfricanSudaneseSwedishSwissSyrianTaiwaneseThaiTlingit-HaidaTohono O'OdhamTonganTrinidadian and TobagonianTsimshianTurkishU.S. Virgin IslanderUgandanUkrainianUruguayanUteVenezuelanVietnameseWelshWest IndianYakamaYaquiYugoslavianYumanYup'ikZimbabwean
Immigration
NonimmigrantsImmigrantsAfghanistanAfricaAlbaniaArgentinaArmeniaAsiaAustraliaAustriaBahamasBangladeshBarbadosBelarusBelgiumBelizeBoliviaBosnia and HerzegovinaBrazilBulgariaBurma/MyanmarCabo VerdeCambodiaCameroonCanadaCaribbeanCentral AmericaChileChinaColombiaCongoCosta RicaCroatiaCubaCzechoslovakiaDenmarkDominicaDominican RepublicEastern AfricaEastern AsiaEastern EuropeEcuadorEgyptEl SalvadorEnglandEritreaEthiopiaEuropeFijiFranceGermanyGhanaGreeceGrenadaGuatemalaGuyanaHaitiHondurasHong KongHungaryIndiaIndonesiaIranIraqIrelandIsraelItalyJamaicaJapanJordanKazakhstanKenyaKoreaKuwaitLaosLatin AmericaLatviaLebanonLiberiaLithuaniaMalaysiaMexicoMicronesiaMiddle AfricaMoroccoNepalNetherlandsNicaraguaNigeriaNorth AmericaNorth MacedoniaNorthern AfricaNorthern EuropeNorwayOceaniaPakistanPanamaPeruPhilippinesPolandPortugalRomaniaRussiaSaudi ArabiaScotlandSenegalSerbiaSierra LeoneSingaporeSomaliaSouth AfricaSouth AmericaSouth Central AsiaSouth Eastern AsiaSouthern EuropeSpainSri LankaSt. Vincent and the GrenadinesSudanSwedenSwitzerlandSyriaTaiwanThailandTrinidad and TobagoTurkeyUgandaUkraineUruguayUzbekistanVenezuelaVietnamWest IndiesWestern AfricaWestern AsiaWestern EuropeYemenZaireZimbabweAzores
Child Poverty Among Girls Under 16
Income
Poverty
Unemployment
Labor Participation
Family Structure
Vehicle Availability
Education Level
Disability

Child Poverty Among Girls Under 16 Comparison

Immigrants from Moldova

Immigrants from Caribbean

Exceptional
Tragic
13.9%
CHILD POVERTY AMONG GIRLS UNDER 16
99.6/ 100
METRIC RATING
38th/ 347
METRIC RANK
20.7%
CHILD POVERTY AMONG GIRLS UNDER 16
0.0/ 100
METRIC RATING
295th/ 347
METRIC RANK

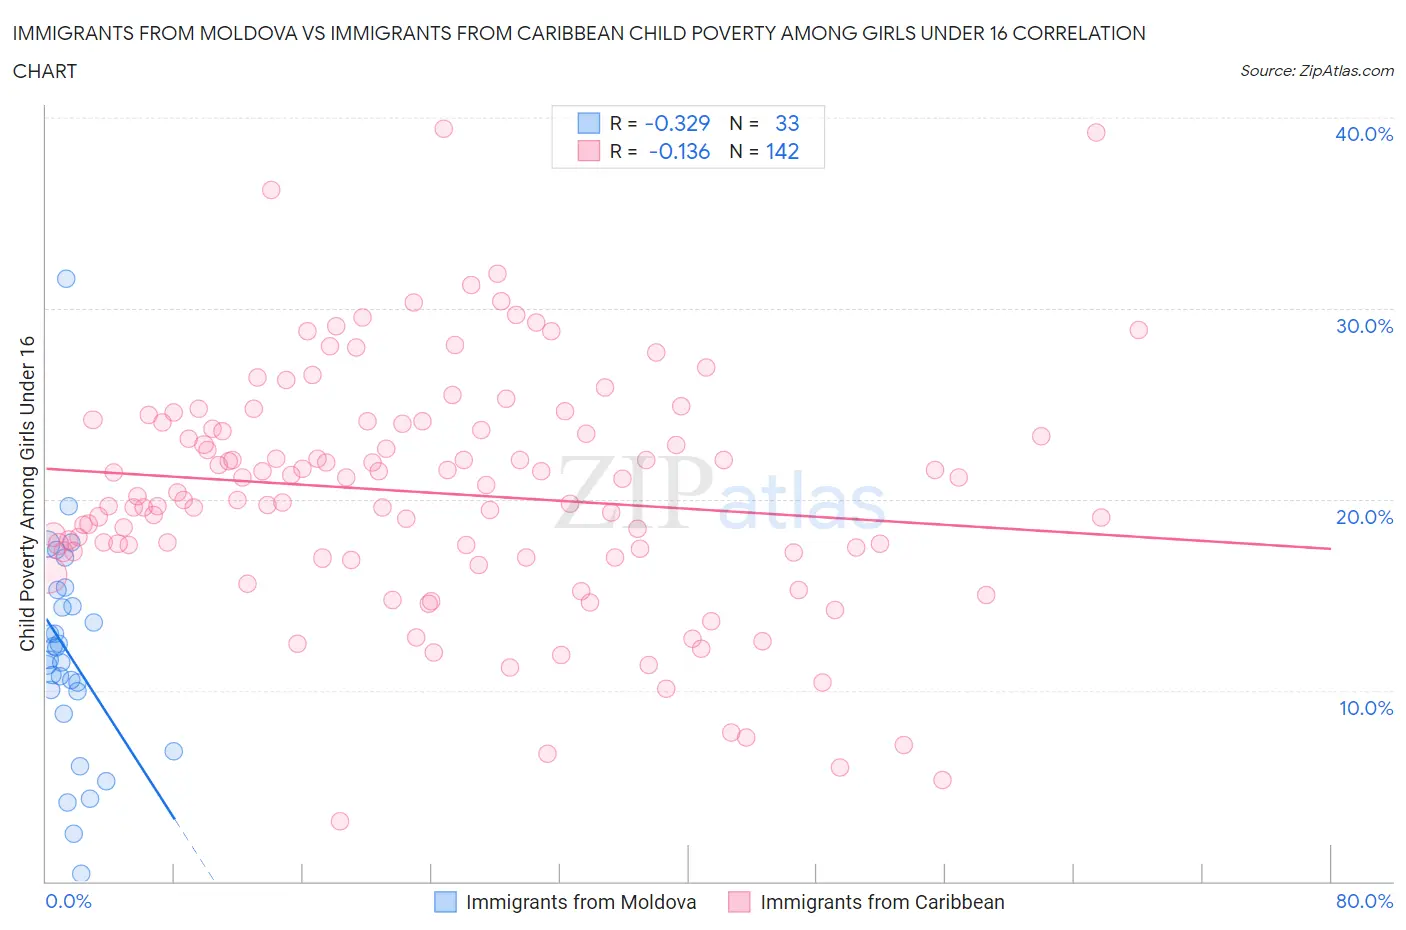
Immigrants from Moldova vs Immigrants from Caribbean Child Poverty Among Girls Under 16 Correlation Chart

The statistical analysis conducted on geographies consisting of 123,298,650 people shows a mild negative correlation between the proportion of Immigrants from Moldova and poverty level among girls under the age of 16 in the United States with a correlation coefficient (R) of -0.329 and weighted average of 13.9%. Similarly, the statistical analysis conducted on geographies consisting of 440,259,837 people shows a poor negative correlation between the proportion of Immigrants from Caribbean and poverty level among girls under the age of 16 in the United States with a correlation coefficient (R) of -0.136 and weighted average of 20.7%, a difference of 48.8%.
Immigrants from Moldova vs Immigrants from Caribbean Child Poverty Among Girls Under 16

Child Poverty Among Girls Under 16 Correlation Summary

MeasurementImmigrants from MoldovaImmigrants from Caribbean
Minimum0.37%3.2%
Maximum31.6%39.4%
Range31.2%36.3%
Mean11.9%20.3%
Median11.6%20.3%
Interquartile 25% (IQ1)9.3%17.3%
Interquartile 75% (IQ3)14.8%23.9%
Interquartile Range (IQR)5.5%6.7%
Standard Deviation (Sample)5.8%6.2%
Standard Deviation (Population)5.7%6.2%

Similar Demographics by Child Poverty Among Girls Under 16

Demographics Similar to Immigrants from Moldova by Child Poverty Among Girls Under 16

In terms of child poverty among girls under 16, the demographic groups most similar to Immigrants from Moldova are Lithuanian (13.9%, a difference of 0.30%), Russian (13.9%, a difference of 0.32%), Immigrants from Northern Europe (13.8%, a difference of 0.47%), Immigrants from Australia (14.0%, a difference of 0.65%), and Immigrants from Sri Lanka (14.0%, a difference of 0.74%).
DemographicsRating | RankChild Poverty Among Girls Under 16
Turks
99.7
/100
|
#31
Exceptional
13.7%
Danes
99.7
/100
|
#32
Exceptional
13.7%
Swedes
99.7
/100
|
#33
Exceptional
13.7%
Maltese
99.7
/100
|
#34
Exceptional
13.7%
Immigrants | Northern Europe
99.6
/100
|
#35
Exceptional
13.8%
Russians
99.6
/100
|
#36
Exceptional
13.9%
Lithuanians
99.6
/100
|
#37
Exceptional
13.9%
Immigrants | Moldova
99.6
/100
|
#38
Exceptional
13.9%
Immigrants | Australia
99.5
/100
|
#39
Exceptional
14.0%
Immigrants | Sri Lanka
99.5
/100
|
#40
Exceptional
14.0%
Immigrants | Bolivia
99.5
/100
|
#41
Exceptional
14.0%
Immigrants | Scotland
99.4
/100
|
#42
Exceptional
14.0%
Koreans
99.4
/100
|
#43
Exceptional
14.1%
Immigrants | Asia
99.4
/100
|
#44
Exceptional
14.1%
Immigrants | Greece
99.3
/100
|
#45
Exceptional
14.1%

Demographics Similar to Immigrants from Caribbean by Child Poverty Among Girls Under 16

In terms of child poverty among girls under 16, the demographic groups most similar to Immigrants from Caribbean are Immigrants from Senegal (20.7%, a difference of 0.030%), Immigrants from Grenada (20.7%, a difference of 0.14%), Immigrants from Latin America (20.6%, a difference of 0.19%), Chippewa (20.6%, a difference of 0.25%), and Immigrants from West Indies (20.7%, a difference of 0.27%).
DemographicsRating | RankChild Poverty Among Girls Under 16
Haitians
0.0
/100
|
#288
Tragic
20.5%
Immigrants | Belize
0.0
/100
|
#289
Tragic
20.6%
Immigrants | Haiti
0.0
/100
|
#290
Tragic
20.6%
Chippewa
0.0
/100
|
#291
Tragic
20.6%
Immigrants | Latin America
0.0
/100
|
#292
Tragic
20.6%
Immigrants | Grenada
0.0
/100
|
#293
Tragic
20.7%
Immigrants | Senegal
0.0
/100
|
#294
Tragic
20.7%
Immigrants | Caribbean
0.0
/100
|
#295
Tragic
20.7%
Immigrants | West Indies
0.0
/100
|
#296
Tragic
20.7%
Inupiat
0.0
/100
|
#297
Tragic
20.8%
Mexicans
0.0
/100
|
#298
Tragic
20.9%
Hispanics or Latinos
0.0
/100
|
#299
Tragic
21.0%
Somalis
0.0
/100
|
#300
Tragic
21.0%
Choctaw
0.0
/100
|
#301
Tragic
21.1%
Seminole
0.0
/100
|
#302
Tragic
21.2%