Immigrants from Moldova vs Bhutanese Poverty
COMPARE
Immigrants from Moldova
Bhutanese
Poverty
Poverty Comparison
Immigrants from Moldova
Bhutanese
10.9%
POVERTY
99.1/ 100
METRIC RATING
44th/ 347
METRIC RANK
10.4%
POVERTY
99.8/ 100
METRIC RATING
12th/ 347
METRIC RANK
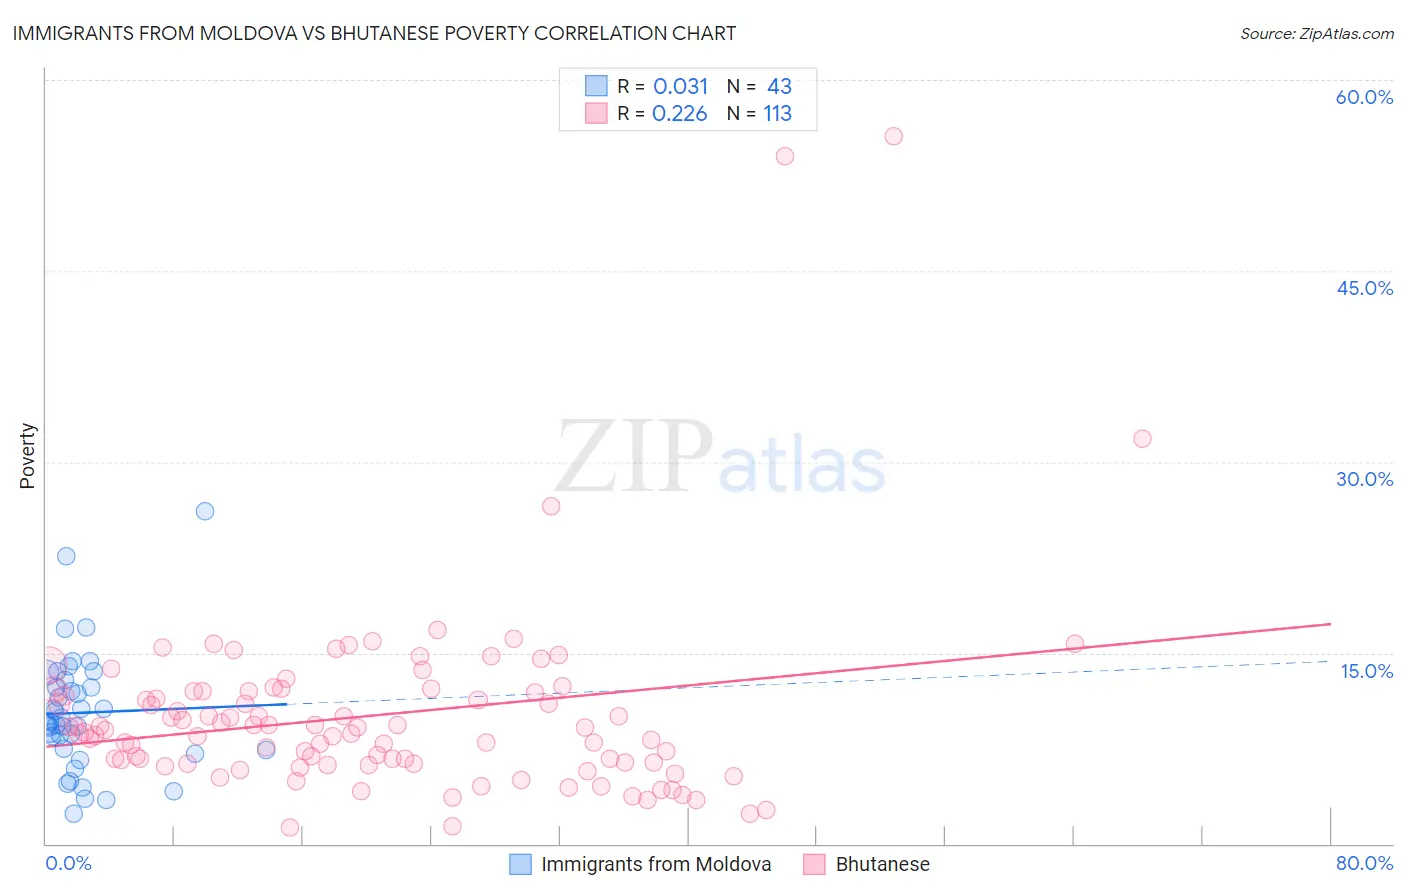
Immigrants from Moldova vs Bhutanese Poverty Correlation Chart
The statistical analysis conducted on geographies consisting of 124,373,713 people shows no correlation between the proportion of Immigrants from Moldova and poverty level in the United States with a correlation coefficient (R) of 0.031 and weighted average of 10.9%. Similarly, the statistical analysis conducted on geographies consisting of 455,158,170 people shows a weak positive correlation between the proportion of Bhutanese and poverty level in the United States with a correlation coefficient (R) of 0.226 and weighted average of 10.4%, a difference of 5.0%.
Poverty Correlation Summary
| Measurement | Immigrants from Moldova | Bhutanese |
| Minimum | 2.4% | 1.3% |
| Maximum | 26.1% | 55.6% |
| Range | 23.7% | 54.3% |
| Mean | 10.3% | 10.1% |
| Median | 9.7% | 9.0% |
| Interquartile 25% (IQ1) | 7.4% | 6.3% |
| Interquartile 75% (IQ3) | 12.9% | 12.0% |
| Interquartile Range (IQR) | 5.5% | 5.6% |
| Standard Deviation (Sample) | 4.8% | 7.5% |
| Standard Deviation (Population) | 4.7% | 7.5% |
Similar Demographics by Poverty
Demographics Similar to Immigrants from Moldova by Poverty
In terms of poverty, the demographic groups most similar to Immigrants from Moldova are Immigrants from Singapore (10.9%, a difference of 0.14%), Korean (10.9%, a difference of 0.19%), Immigrants from Iran (10.9%, a difference of 0.41%), Russian (10.9%, a difference of 0.50%), and Turkish (11.0%, a difference of 0.51%).
| Demographics | Rating | Rank | Poverty |
| Immigrants | Greece | 99.3 /100 | #37 | Exceptional 10.8% |
| Czechs | 99.3 /100 | #38 | Exceptional 10.8% |
| Immigrants | Pakistan | 99.3 /100 | #39 | Exceptional 10.8% |
| Russians | 99.3 /100 | #40 | Exceptional 10.9% |
| Immigrants | Iran | 99.2 /100 | #41 | Exceptional 10.9% |
| Koreans | 99.2 /100 | #42 | Exceptional 10.9% |
| Immigrants | Singapore | 99.2 /100 | #43 | Exceptional 10.9% |
| Immigrants | Moldova | 99.1 /100 | #44 | Exceptional 10.9% |
| Turks | 98.9 /100 | #45 | Exceptional 11.0% |
| Immigrants | Czechoslovakia | 98.9 /100 | #46 | Exceptional 11.0% |
| Immigrants | Romania | 98.9 /100 | #47 | Exceptional 11.0% |
| Slovenes | 98.9 /100 | #48 | Exceptional 11.0% |
| Immigrants | Japan | 98.9 /100 | #49 | Exceptional 11.0% |
| Asians | 98.9 /100 | #50 | Exceptional 11.0% |
| Immigrants | Croatia | 98.7 /100 | #51 | Exceptional 11.0% |
Demographics Similar to Bhutanese by Poverty
In terms of poverty, the demographic groups most similar to Bhutanese are Immigrants from Hong Kong (10.4%, a difference of 0.22%), Immigrants from Lithuania (10.3%, a difference of 0.35%), Immigrants from Bolivia (10.4%, a difference of 0.53%), Bolivian (10.4%, a difference of 0.54%), and Lithuanian (10.5%, a difference of 0.84%).
| Demographics | Rating | Rank | Poverty |
| Immigrants | Ireland | 99.9 /100 | #5 | Exceptional 10.1% |
| Assyrians/Chaldeans/Syriacs | 99.9 /100 | #6 | Exceptional 10.1% |
| Filipinos | 99.9 /100 | #7 | Exceptional 10.1% |
| Maltese | 99.9 /100 | #8 | Exceptional 10.2% |
| Immigrants | South Central Asia | 99.9 /100 | #9 | Exceptional 10.2% |
| Bulgarians | 99.9 /100 | #10 | Exceptional 10.2% |
| Immigrants | Lithuania | 99.9 /100 | #11 | Exceptional 10.3% |
| Bhutanese | 99.8 /100 | #12 | Exceptional 10.4% |
| Immigrants | Hong Kong | 99.8 /100 | #13 | Exceptional 10.4% |
| Immigrants | Bolivia | 99.8 /100 | #14 | Exceptional 10.4% |
| Bolivians | 99.8 /100 | #15 | Exceptional 10.4% |
| Lithuanians | 99.8 /100 | #16 | Exceptional 10.5% |
| Norwegians | 99.8 /100 | #17 | Exceptional 10.5% |
| Latvians | 99.8 /100 | #18 | Exceptional 10.5% |
| Immigrants | Scotland | 99.7 /100 | #19 | Exceptional 10.6% |