Immigrants from Moldova vs Basque Female Poverty
COMPARE
Immigrants from Moldova
Basque
Female Poverty
Female Poverty Comparison
Immigrants from Moldova
Basques
11.9%
FEMALE POVERTY
99.2/ 100
METRIC RATING
42nd/ 347
METRIC RANK
12.9%
FEMALE POVERTY
83.1/ 100
METRIC RATING
139th/ 347
METRIC RANK
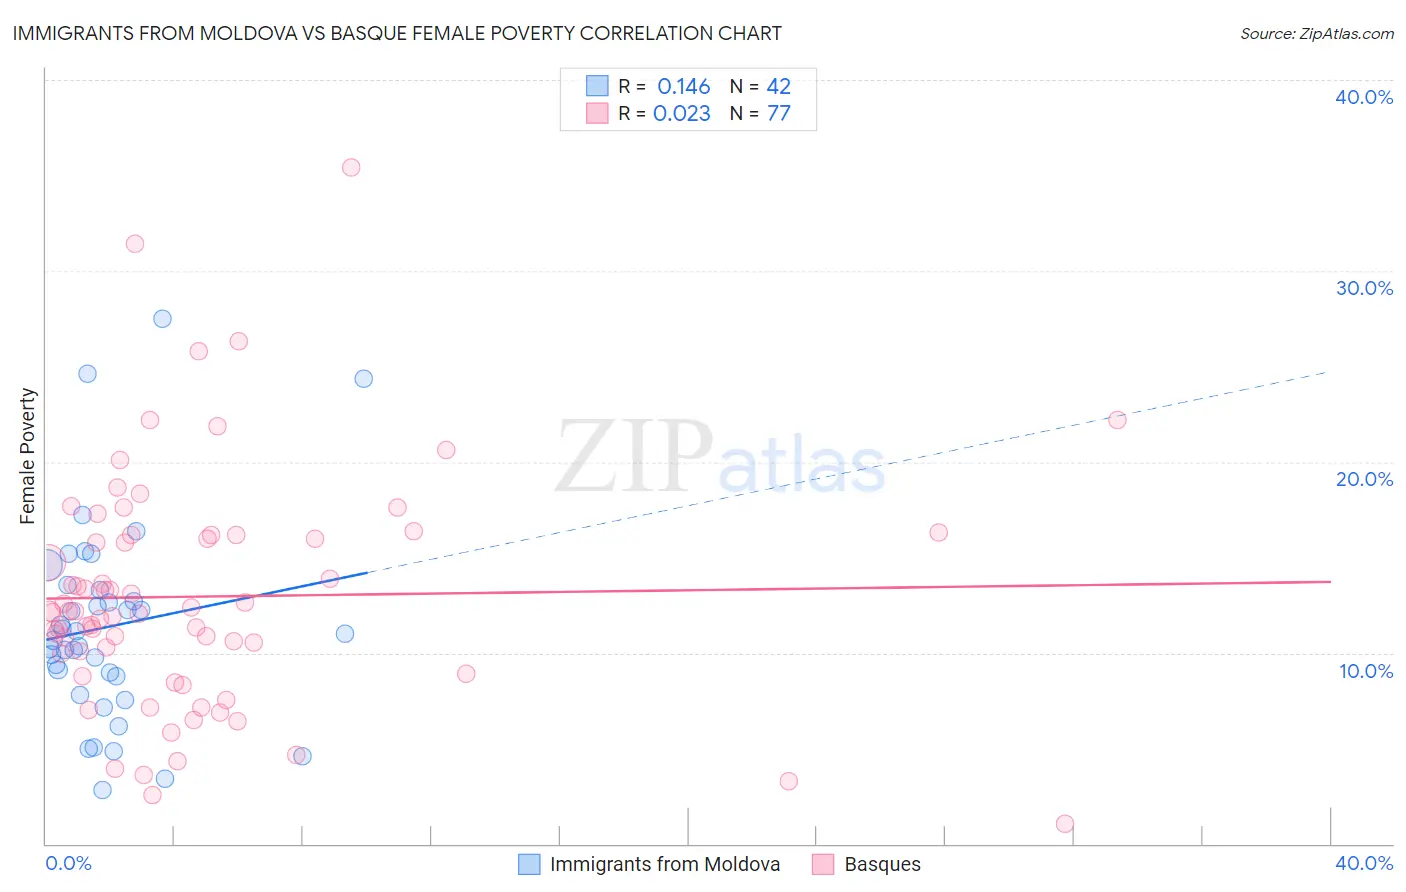
Immigrants from Moldova vs Basque Female Poverty Correlation Chart
The statistical analysis conducted on geographies consisting of 124,368,843 people shows a poor positive correlation between the proportion of Immigrants from Moldova and poverty level among females in the United States with a correlation coefficient (R) of 0.146 and weighted average of 11.9%. Similarly, the statistical analysis conducted on geographies consisting of 165,726,735 people shows no correlation between the proportion of Basques and poverty level among females in the United States with a correlation coefficient (R) of 0.023 and weighted average of 12.9%, a difference of 8.9%.
Female Poverty Correlation Summary
| Measurement | Immigrants from Moldova | Basque |
| Minimum | 2.8% | 1.1% |
| Maximum | 27.5% | 35.4% |
| Range | 24.7% | 34.4% |
| Mean | 11.4% | 12.9% |
| Median | 10.8% | 12.2% |
| Interquartile 25% (IQ1) | 8.7% | 9.4% |
| Interquartile 75% (IQ3) | 13.3% | 16.2% |
| Interquartile Range (IQR) | 4.6% | 6.7% |
| Standard Deviation (Sample) | 5.3% | 6.2% |
| Standard Deviation (Population) | 5.2% | 6.1% |
Similar Demographics by Female Poverty
Demographics Similar to Immigrants from Moldova by Female Poverty
In terms of female poverty, the demographic groups most similar to Immigrants from Moldova are Czech (11.9%, a difference of 0.0%), Korean (11.9%, a difference of 0.040%), Tongan (11.9%, a difference of 0.11%), Macedonian (11.8%, a difference of 0.18%), and Immigrants from Czechoslovakia (11.9%, a difference of 0.20%).
| Demographics | Rating | Rank | Female Poverty |
| Immigrants | Iran | 99.4 /100 | #35 | Exceptional 11.8% |
| Immigrants | Pakistan | 99.4 /100 | #36 | Exceptional 11.8% |
| Immigrants | Greece | 99.3 /100 | #37 | Exceptional 11.8% |
| Russians | 99.3 /100 | #38 | Exceptional 11.8% |
| Immigrants | Poland | 99.3 /100 | #39 | Exceptional 11.8% |
| Macedonians | 99.3 /100 | #40 | Exceptional 11.8% |
| Czechs | 99.2 /100 | #41 | Exceptional 11.9% |
| Immigrants | Moldova | 99.2 /100 | #42 | Exceptional 11.9% |
| Koreans | 99.2 /100 | #43 | Exceptional 11.9% |
| Tongans | 99.2 /100 | #44 | Exceptional 11.9% |
| Immigrants | Czechoslovakia | 99.2 /100 | #45 | Exceptional 11.9% |
| Turks | 99.2 /100 | #46 | Exceptional 11.9% |
| Asians | 99.1 /100 | #47 | Exceptional 11.9% |
| Immigrants | Japan | 99.0 /100 | #48 | Exceptional 11.9% |
| Immigrants | Romania | 99.0 /100 | #49 | Exceptional 12.0% |
Demographics Similar to Basques by Female Poverty
In terms of female poverty, the demographic groups most similar to Basques are Pakistani (12.9%, a difference of 0.010%), Immigrants from France (12.9%, a difference of 0.090%), Chilean (12.9%, a difference of 0.31%), Icelander (13.0%, a difference of 0.34%), and Peruvian (12.9%, a difference of 0.40%).
| Demographics | Rating | Rank | Female Poverty |
| Immigrants | Jordan | 86.9 /100 | #132 | Excellent 12.8% |
| Immigrants | Western Europe | 86.6 /100 | #133 | Excellent 12.8% |
| Immigrants | Switzerland | 85.8 /100 | #134 | Excellent 12.9% |
| French | 85.6 /100 | #135 | Excellent 12.9% |
| Peruvians | 85.2 /100 | #136 | Excellent 12.9% |
| Chileans | 84.7 /100 | #137 | Excellent 12.9% |
| Immigrants | France | 83.6 /100 | #138 | Excellent 12.9% |
| Basques | 83.1 /100 | #139 | Excellent 12.9% |
| Pakistanis | 83.0 /100 | #140 | Excellent 12.9% |
| Icelanders | 81.1 /100 | #141 | Excellent 13.0% |
| Brazilians | 80.5 /100 | #142 | Excellent 13.0% |
| Immigrants | Malaysia | 80.4 /100 | #143 | Excellent 13.0% |
| Afghans | 79.8 /100 | #144 | Good 13.0% |
| Syrians | 79.6 /100 | #145 | Good 13.0% |
| Immigrants | Peru | 79.1 /100 | #146 | Good 13.0% |