Immigrants from Micronesia vs Jamaican Child Poverty Under the Age of 16
COMPARE
Immigrants from Micronesia
Jamaican
Child Poverty Under the Age of 16
Child Poverty Under the Age of 16 Comparison
Immigrants from Micronesia
Jamaicans
18.0%
CHILD POVERTY UNDER THE AGE OF 16
2.3/ 100
METRIC RATING
228th/ 347
METRIC RANK
19.7%
CHILD POVERTY UNDER THE AGE OF 16
0.1/ 100
METRIC RATING
268th/ 347
METRIC RANK
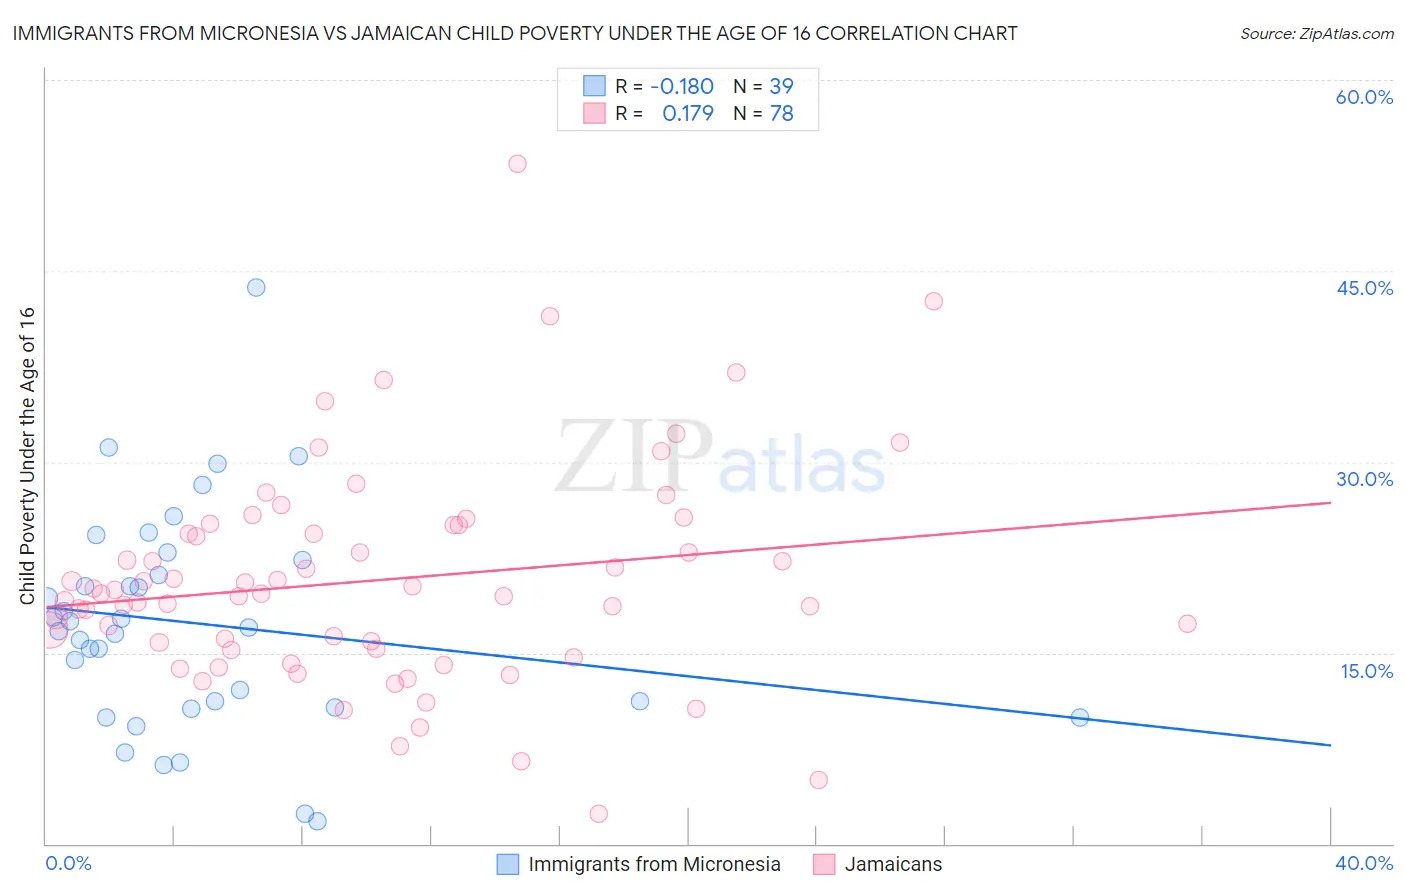
Immigrants from Micronesia vs Jamaican Child Poverty Under the Age of 16 Correlation Chart
The statistical analysis conducted on geographies consisting of 61,555,801 people shows a poor negative correlation between the proportion of Immigrants from Micronesia and poverty level among children under the age of 16 in the United States with a correlation coefficient (R) of -0.180 and weighted average of 18.0%. Similarly, the statistical analysis conducted on geographies consisting of 365,413,403 people shows a poor positive correlation between the proportion of Jamaicans and poverty level among children under the age of 16 in the United States with a correlation coefficient (R) of 0.179 and weighted average of 19.7%, a difference of 9.2%.
Child Poverty Under the Age of 16 Correlation Summary
| Measurement | Immigrants from Micronesia | Jamaican |
| Minimum | 1.7% | 2.4% |
| Maximum | 43.7% | 53.4% |
| Range | 41.9% | 51.0% |
| Mean | 17.3% | 20.7% |
| Median | 17.0% | 19.6% |
| Interquartile 25% (IQ1) | 10.7% | 15.3% |
| Interquartile 75% (IQ3) | 22.3% | 25.0% |
| Interquartile Range (IQR) | 11.6% | 9.7% |
| Standard Deviation (Sample) | 8.6% | 8.6% |
| Standard Deviation (Population) | 8.5% | 8.5% |
Similar Demographics by Child Poverty Under the Age of 16
Demographics Similar to Immigrants from Micronesia by Child Poverty Under the Age of 16
In terms of child poverty under the age of 16, the demographic groups most similar to Immigrants from Micronesia are Immigrants from Africa (18.0%, a difference of 0.15%), Bermudan (18.0%, a difference of 0.34%), Nonimmigrants (17.9%, a difference of 0.40%), Marshallese (18.1%, a difference of 0.73%), and Osage (17.9%, a difference of 0.77%).
| Demographics | Rating | Rank | Child Poverty Under the Age of 16 |
| Cubans | 3.7 /100 | #221 | Tragic 17.8% |
| Immigrants | Armenia | 3.6 /100 | #222 | Tragic 17.8% |
| Immigrants | Cambodia | 3.3 /100 | #223 | Tragic 17.8% |
| Osage | 3.1 /100 | #224 | Tragic 17.9% |
| Immigrants | Nonimmigrants | 2.7 /100 | #225 | Tragic 17.9% |
| Bermudans | 2.6 /100 | #226 | Tragic 18.0% |
| Immigrants | Africa | 2.5 /100 | #227 | Tragic 18.0% |
| Immigrants | Micronesia | 2.3 /100 | #228 | Tragic 18.0% |
| Marshallese | 1.8 /100 | #229 | Tragic 18.1% |
| Nepalese | 1.7 /100 | #230 | Tragic 18.2% |
| Nicaraguans | 1.7 /100 | #231 | Tragic 18.2% |
| Americans | 1.2 /100 | #232 | Tragic 18.3% |
| Fijians | 1.1 /100 | #233 | Tragic 18.4% |
| Immigrants | Nigeria | 1.0 /100 | #234 | Tragic 18.4% |
| Nigerians | 1.0 /100 | #235 | Tragic 18.4% |
Demographics Similar to Jamaicans by Child Poverty Under the Age of 16
In terms of child poverty under the age of 16, the demographic groups most similar to Jamaicans are Immigrants from El Salvador (19.7%, a difference of 0.060%), Spanish American Indian (19.7%, a difference of 0.080%), Immigrants from Liberia (19.7%, a difference of 0.21%), Immigrants from Bangladesh (19.8%, a difference of 0.51%), and Cherokee (19.5%, a difference of 0.66%).
| Demographics | Rating | Rank | Child Poverty Under the Age of 16 |
| Immigrants | Burma/Myanmar | 0.1 /100 | #261 | Tragic 19.4% |
| Immigrants | Guyana | 0.1 /100 | #262 | Tragic 19.4% |
| Vietnamese | 0.1 /100 | #263 | Tragic 19.4% |
| Immigrants | Ecuador | 0.1 /100 | #264 | Tragic 19.4% |
| Chickasaw | 0.1 /100 | #265 | Tragic 19.5% |
| Liberians | 0.1 /100 | #266 | Tragic 19.5% |
| Cherokee | 0.1 /100 | #267 | Tragic 19.5% |
| Jamaicans | 0.1 /100 | #268 | Tragic 19.7% |
| Immigrants | El Salvador | 0.1 /100 | #269 | Tragic 19.7% |
| Spanish American Indians | 0.1 /100 | #270 | Tragic 19.7% |
| Immigrants | Liberia | 0.1 /100 | #271 | Tragic 19.7% |
| Immigrants | Bangladesh | 0.1 /100 | #272 | Tragic 19.8% |
| Immigrants | Jamaica | 0.1 /100 | #273 | Tragic 19.8% |
| Immigrants | Cabo Verde | 0.1 /100 | #274 | Tragic 19.9% |
| Immigrants | Barbados | 0.1 /100 | #275 | Tragic 19.9% |