Immigrants from Lithuania vs Mexican Female Poverty
COMPARE
Immigrants from Lithuania
Mexican
Female Poverty
Female Poverty Comparison
Immigrants from Lithuania
Mexicans
11.3%
FEMALE POVERTY
99.9/ 100
METRIC RATING
13th/ 347
METRIC RANK
16.5%
FEMALE POVERTY
0.0/ 100
METRIC RATING
297th/ 347
METRIC RANK
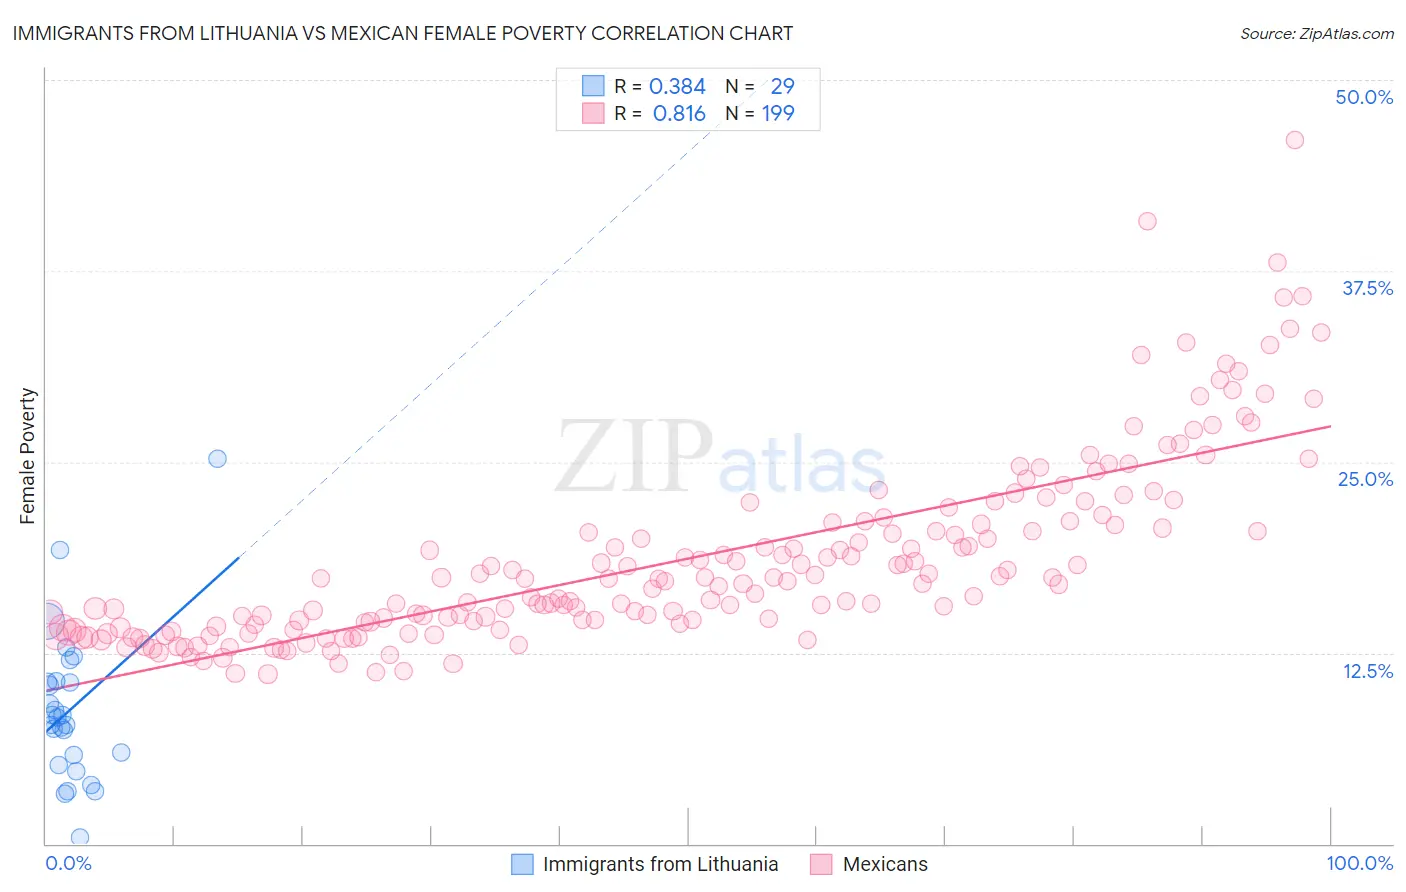
Immigrants from Lithuania vs Mexican Female Poverty Correlation Chart
The statistical analysis conducted on geographies consisting of 117,711,686 people shows a mild positive correlation between the proportion of Immigrants from Lithuania and poverty level among females in the United States with a correlation coefficient (R) of 0.384 and weighted average of 11.3%. Similarly, the statistical analysis conducted on geographies consisting of 564,122,541 people shows a very strong positive correlation between the proportion of Mexicans and poverty level among females in the United States with a correlation coefficient (R) of 0.816 and weighted average of 16.5%, a difference of 46.4%.
Female Poverty Correlation Summary
| Measurement | Immigrants from Lithuania | Mexican |
| Minimum | 0.39% | 11.1% |
| Maximum | 25.2% | 46.1% |
| Range | 24.8% | 35.0% |
| Mean | 8.8% | 18.6% |
| Median | 8.3% | 17.2% |
| Interquartile 25% (IQ1) | 5.5% | 14.3% |
| Interquartile 75% (IQ3) | 10.6% | 20.9% |
| Interquartile Range (IQR) | 5.1% | 6.6% |
| Standard Deviation (Sample) | 5.0% | 6.1% |
| Standard Deviation (Population) | 4.9% | 6.1% |
Similar Demographics by Female Poverty
Demographics Similar to Immigrants from Lithuania by Female Poverty
In terms of female poverty, the demographic groups most similar to Immigrants from Lithuania are Bhutanese (11.3%, a difference of 0.010%), Maltese (11.2%, a difference of 0.47%), Immigrants from Hong Kong (11.2%, a difference of 0.58%), Lithuanian (11.4%, a difference of 0.96%), and Latvian (11.4%, a difference of 1.3%).
| Demographics | Rating | Rank | Female Poverty |
| Immigrants | Ireland | 99.9 /100 | #6 | Exceptional 11.0% |
| Assyrians/Chaldeans/Syriacs | 99.9 /100 | #7 | Exceptional 11.0% |
| Immigrants | South Central Asia | 99.9 /100 | #8 | Exceptional 11.1% |
| Bulgarians | 99.9 /100 | #9 | Exceptional 11.1% |
| Immigrants | Hong Kong | 99.9 /100 | #10 | Exceptional 11.2% |
| Maltese | 99.9 /100 | #11 | Exceptional 11.2% |
| Bhutanese | 99.9 /100 | #12 | Exceptional 11.3% |
| Immigrants | Lithuania | 99.9 /100 | #13 | Exceptional 11.3% |
| Lithuanians | 99.8 /100 | #14 | Exceptional 11.4% |
| Latvians | 99.8 /100 | #15 | Exceptional 11.4% |
| Immigrants | Bolivia | 99.8 /100 | #16 | Exceptional 11.5% |
| Bolivians | 99.8 /100 | #17 | Exceptional 11.5% |
| Immigrants | Scotland | 99.8 /100 | #18 | Exceptional 11.5% |
| Norwegians | 99.8 /100 | #19 | Exceptional 11.5% |
| Eastern Europeans | 99.7 /100 | #20 | Exceptional 11.5% |
Demographics Similar to Mexicans by Female Poverty
In terms of female poverty, the demographic groups most similar to Mexicans are Somali (16.6%, a difference of 0.20%), Immigrants from Senegal (16.5%, a difference of 0.40%), Senegalese (16.5%, a difference of 0.42%), Immigrants from Cabo Verde (16.4%, a difference of 0.49%), and Immigrants from Latin America (16.4%, a difference of 0.53%).
| Demographics | Rating | Rank | Female Poverty |
| Immigrants | Bangladesh | 0.0 /100 | #290 | Tragic 16.4% |
| Yaqui | 0.0 /100 | #291 | Tragic 16.4% |
| Immigrants | Zaire | 0.0 /100 | #292 | Tragic 16.4% |
| Immigrants | Latin America | 0.0 /100 | #293 | Tragic 16.4% |
| Immigrants | Cabo Verde | 0.0 /100 | #294 | Tragic 16.4% |
| Senegalese | 0.0 /100 | #295 | Tragic 16.5% |
| Immigrants | Senegal | 0.0 /100 | #296 | Tragic 16.5% |
| Mexicans | 0.0 /100 | #297 | Tragic 16.5% |
| Somalis | 0.0 /100 | #298 | Tragic 16.6% |
| Hispanics or Latinos | 0.0 /100 | #299 | Tragic 16.6% |
| Bahamians | 0.0 /100 | #300 | Tragic 16.6% |
| Guatemalans | 0.0 /100 | #301 | Tragic 16.7% |
| Chippewa | 0.0 /100 | #302 | Tragic 16.7% |
| Choctaw | 0.0 /100 | #303 | Tragic 16.8% |
| Immigrants | Central America | 0.0 /100 | #304 | Tragic 16.8% |