Immigrants from Lebanon vs Immigrants from Cuba Child Poverty Under the Age of 16

COMPARE

Immigrants from Lebanon
Race
Ancestry
AfghanAfricanAlaska NativeAlaskan AthabascanAlbanianAleutAlsatianAmericanApacheArabArapahoArgentineanArmenianAssyrian/Chaldean/SyriacAustralianAustrianBahamianBangladeshiBarbadianBasqueBelgianBelizeanBermudanBhutaneseBlackfeetBolivianBrazilianBritishBritish West IndianBulgarianBurmeseCajunCambodianCanadianCape VerdeanCarpatho RusynCelticCentral AmericanCentral American IndianCherokeeCheyenneChickasawChileanChineseChippewaChoctawColombianColvilleComancheCosta RicanCreeCreekCroatianCrowCubanCypriotCzechCzechoslovakianDanishDelawareDominicanDutchDutch West IndianEastern EuropeanEcuadorianEgyptianEnglishEstonianEthiopianEuropeanFijianFilipinoFinnishFrenchFrench American IndianFrench CanadianGermanGerman RussianGhanaianGreekGuamanian/ChamorroGuatemalanGuyaneseHaitianHmongHonduranHopiHoumaHungarianIcelanderIndian (Asian)IndonesianInupiatIranianIraqiIrishIroquoisIsraeliItalianJamaicanJapaneseJordanianKenyanKiowaKoreanLaotianLatvianLebaneseLiberianLithuanianLumbeeLuxembourgerMacedonianMalaysianMalteseMarshalleseMenomineeMexicanMexican American IndianMongolianMoroccanNative HawaiianNavajoNepaleseNew ZealanderNicaraguanNigerianNorthern EuropeanNorwegianOkinawanOsageOttawaPaiutePakistaniPalestinianPanamanianParaguayanPennsylvania GermanPeruvianPimaPolishPortuguesePotawatomiPuebloPuerto RicanPuget Sound SalishRomanianRussianSalvadoranSamoanScandinavianScotch-IrishScottishSeminoleSenegaleseSerbianShoshoneSierra LeoneanSiouxSlavicSlovakSloveneSomaliSouth AfricanSouth AmericanSouth American IndianSoviet UnionSpaniardSpanishSpanish AmericanSpanish American IndianSri LankanSubsaharan AfricanSudaneseSwedishSwissSyrianTaiwaneseThaiTlingit-HaidaTohono O'OdhamTonganTrinidadian and TobagonianTsimshianTurkishU.S. Virgin IslanderUgandanUkrainianUruguayanUteVenezuelanVietnameseWelshWest IndianYakamaYaquiYugoslavianYumanYup'ikZimbabwean
Immigration
NonimmigrantsImmigrantsAfghanistanAfricaAlbaniaArgentinaArmeniaAsiaAustraliaAustriaBahamasBangladeshBarbadosBelarusBelgiumBelizeBoliviaBosnia and HerzegovinaBrazilBulgariaBurma/MyanmarCabo VerdeCambodiaCameroonCanadaCaribbeanCentral AmericaChileChinaColombiaCongoCosta RicaCroatiaCzechoslovakiaDenmarkDominicaDominican RepublicEastern AfricaEastern AsiaEastern EuropeEcuadorEgyptEl SalvadorEnglandEritreaEthiopiaEuropeFijiFranceGermanyGhanaGreeceGrenadaGuatemalaGuyanaHaitiHondurasHong KongHungaryIndiaIndonesiaIranIraqIrelandIsraelItalyJamaicaJapanJordanKazakhstanKenyaKoreaKuwaitLaosLatin AmericaLatviaLebanonLiberiaLithuaniaMalaysiaMexicoMicronesiaMiddle AfricaMoldovaMoroccoNepalNetherlandsNicaraguaNigeriaNorth AmericaNorth MacedoniaNorthern AfricaNorthern EuropeNorwayOceaniaPakistanPanamaPeruPhilippinesPolandPortugalRomaniaRussiaSaudi ArabiaScotlandSenegalSerbiaSierra LeoneSingaporeSomaliaSouth AfricaSouth AmericaSouth Central AsiaSouth Eastern AsiaSouthern EuropeSpainSri LankaSt. Vincent and the GrenadinesSudanSwedenSwitzerlandSyriaTaiwanThailandTrinidad and TobagoTurkeyUgandaUkraineUruguayUzbekistanVenezuelaVietnamWest IndiesWestern AfricaWestern AsiaWestern EuropeYemenZaireZimbabweAzores
Immigrants from Cuba
Race
Ancestry
AfghanAfricanAlaska NativeAlaskan AthabascanAlbanianAleutAlsatianAmericanApacheArabArapahoArgentineanArmenianAssyrian/Chaldean/SyriacAustralianAustrianBahamianBangladeshiBarbadianBasqueBelgianBelizeanBermudanBhutaneseBlackfeetBolivianBrazilianBritishBritish West IndianBulgarianBurmeseCajunCambodianCanadianCape VerdeanCarpatho RusynCelticCentral AmericanCentral American IndianCherokeeCheyenneChickasawChileanChineseChippewaChoctawColombianColvilleComancheCosta RicanCreeCreekCroatianCrowCubanCypriotCzechCzechoslovakianDanishDelawareDominicanDutchDutch West IndianEastern EuropeanEcuadorianEgyptianEnglishEstonianEthiopianEuropeanFijianFilipinoFinnishFrenchFrench American IndianFrench CanadianGermanGerman RussianGhanaianGreekGuamanian/ChamorroGuatemalanGuyaneseHaitianHmongHonduranHopiHoumaHungarianIcelanderIndian (Asian)IndonesianInupiatIranianIraqiIrishIroquoisIsraeliItalianJamaicanJapaneseJordanianKenyanKiowaKoreanLaotianLatvianLebaneseLiberianLithuanianLumbeeLuxembourgerMacedonianMalaysianMalteseMarshalleseMenomineeMexicanMexican American IndianMongolianMoroccanNative HawaiianNavajoNepaleseNew ZealanderNicaraguanNigerianNorthern EuropeanNorwegianOkinawanOsageOttawaPaiutePakistaniPalestinianPanamanianParaguayanPennsylvania GermanPeruvianPimaPolishPortuguesePotawatomiPuebloPuerto RicanPuget Sound SalishRomanianRussianSalvadoranSamoanScandinavianScotch-IrishScottishSeminoleSenegaleseSerbianShoshoneSierra LeoneanSiouxSlavicSlovakSloveneSomaliSouth AfricanSouth AmericanSouth American IndianSoviet UnionSpaniardSpanishSpanish AmericanSpanish American IndianSri LankanSubsaharan AfricanSudaneseSwedishSwissSyrianTaiwaneseThaiTlingit-HaidaTohono O'OdhamTonganTrinidadian and TobagonianTsimshianTurkishU.S. Virgin IslanderUgandanUkrainianUruguayanUteVenezuelanVietnameseWelshWest IndianYakamaYaquiYugoslavianYumanYup'ikZimbabwean
Immigration
NonimmigrantsImmigrantsAfghanistanAfricaAlbaniaArgentinaArmeniaAsiaAustraliaAustriaBahamasBangladeshBarbadosBelarusBelgiumBelizeBoliviaBosnia and HerzegovinaBrazilBulgariaBurma/MyanmarCabo VerdeCambodiaCameroonCanadaCaribbeanCentral AmericaChileChinaColombiaCongoCosta RicaCroatiaCubaCzechoslovakiaDenmarkDominicaDominican RepublicEastern AfricaEastern AsiaEastern EuropeEcuadorEgyptEl SalvadorEnglandEritreaEthiopiaEuropeFijiFranceGermanyGhanaGreeceGrenadaGuatemalaGuyanaHaitiHondurasHong KongHungaryIndiaIndonesiaIranIraqIrelandIsraelItalyJamaicaJapanJordanKazakhstanKenyaKoreaKuwaitLaosLatin AmericaLatviaLiberiaLithuaniaMalaysiaMexicoMicronesiaMiddle AfricaMoldovaMoroccoNepalNetherlandsNicaraguaNigeriaNorth AmericaNorth MacedoniaNorthern AfricaNorthern EuropeNorwayOceaniaPakistanPanamaPeruPhilippinesPolandPortugalRomaniaRussiaSaudi ArabiaScotlandSenegalSerbiaSierra LeoneSingaporeSomaliaSouth AfricaSouth AmericaSouth Central AsiaSouth Eastern AsiaSouthern EuropeSpainSri LankaSt. Vincent and the GrenadinesSudanSwedenSwitzerlandSyriaTaiwanThailandTrinidad and TobagoTurkeyUgandaUkraineUruguayUzbekistanVenezuelaVietnamWest IndiesWestern AfricaWestern AsiaWestern EuropeYemenZaireZimbabweAzores
Child Poverty Under the Age of 16
Income
Poverty
Unemployment
Labor Participation
Family Structure
Vehicle Availability
Education Level
Disability

Child Poverty Under the Age of 16 Comparison

Immigrants from Lebanon

Immigrants from Cuba

Fair
Tragic
16.8%
CHILD POVERTY UNDER THE AGE OF 16
22.0/ 100
METRIC RATING
196th/ 347
METRIC RANK
18.7%
CHILD POVERTY UNDER THE AGE OF 16
0.6/ 100
METRIC RATING
243rd/ 347
METRIC RANK

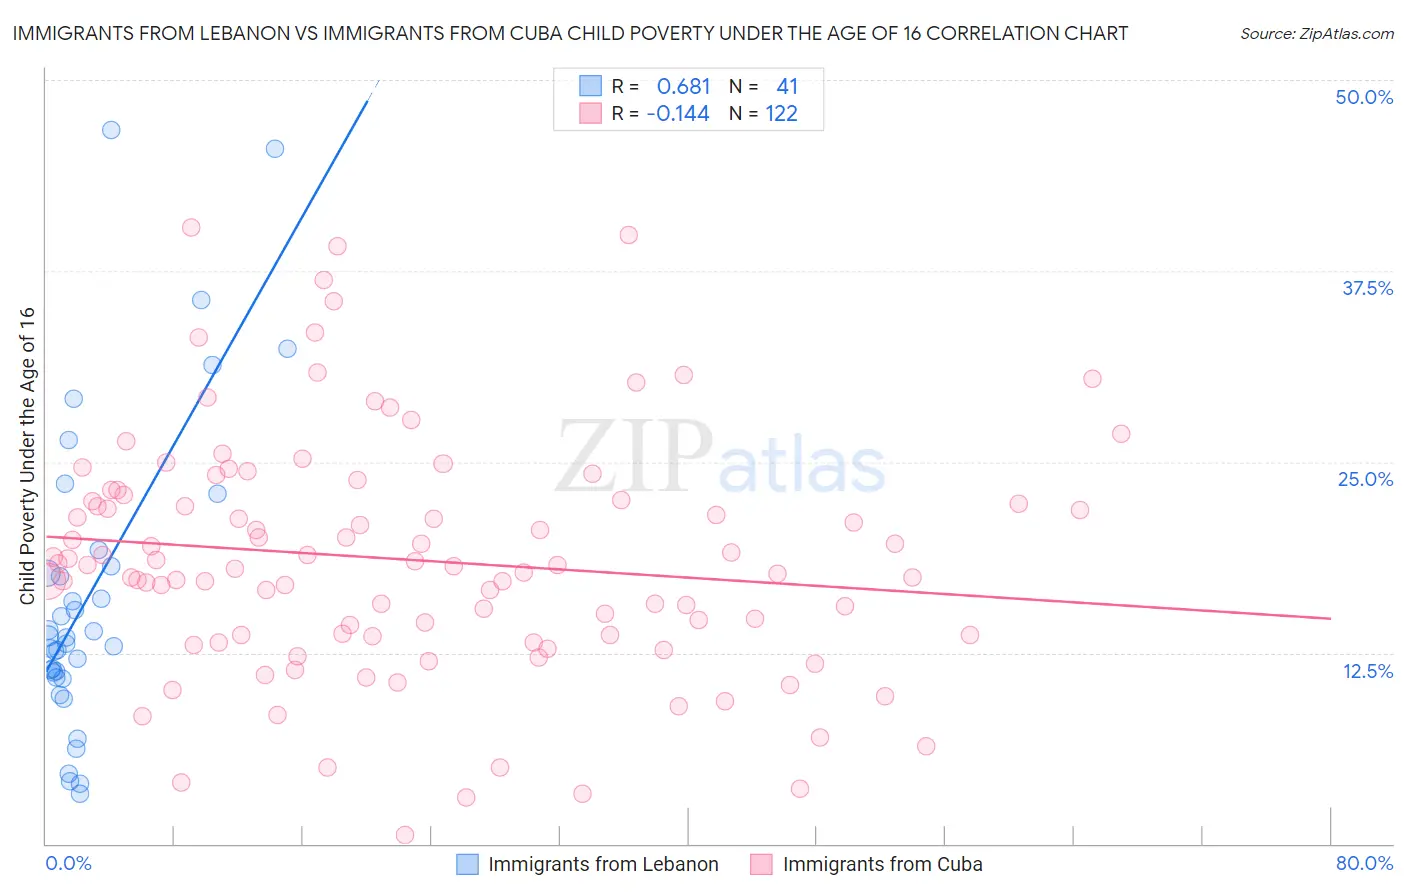
Immigrants from Lebanon vs Immigrants from Cuba Child Poverty Under the Age of 16 Correlation Chart

The statistical analysis conducted on geographies consisting of 216,197,294 people shows a significant positive correlation between the proportion of Immigrants from Lebanon and poverty level among children under the age of 16 in the United States with a correlation coefficient (R) of 0.681 and weighted average of 16.8%. Similarly, the statistical analysis conducted on geographies consisting of 323,831,024 people shows a poor negative correlation between the proportion of Immigrants from Cuba and poverty level among children under the age of 16 in the United States with a correlation coefficient (R) of -0.144 and weighted average of 18.7%, a difference of 11.1%.
Immigrants from Lebanon vs Immigrants from Cuba Child Poverty Under the Age of 16

Child Poverty Under the Age of 16 Correlation Summary

MeasurementImmigrants from LebanonImmigrants from Cuba
Minimum3.3%0.61%
Maximum46.8%40.4%
Range43.5%39.8%
Mean16.5%18.6%
Median13.5%18.2%
Interquartile 25% (IQ1)11.0%13.6%
Interquartile 75% (IQ3)18.7%22.5%
Interquartile Range (IQR)7.7%8.9%
Standard Deviation (Sample)10.2%7.8%
Standard Deviation (Population)10.1%7.8%

Similar Demographics by Child Poverty Under the Age of 16

Demographics Similar to Immigrants from Lebanon by Child Poverty Under the Age of 16

In terms of child poverty under the age of 16, the demographic groups most similar to Immigrants from Lebanon are Immigrants from Uganda (16.8%, a difference of 0.080%), Immigrants from Uruguay (16.8%, a difference of 0.17%), Spaniard (16.8%, a difference of 0.19%), Spanish (16.7%, a difference of 0.39%), and Immigrants from Kenya (16.9%, a difference of 0.52%).
DemographicsRating | RankChild Poverty Under the Age of 16
Immigrants | Portugal
30.0
/100
|
#189
Fair
16.6%
Immigrants | Costa Rica
29.6
/100
|
#190
Fair
16.6%
Immigrants | Iraq
28.3
/100
|
#191
Fair
16.7%
Spanish
24.5
/100
|
#192
Fair
16.7%
Spaniards
23.2
/100
|
#193
Fair
16.8%
Immigrants | Uruguay
23.1
/100
|
#194
Fair
16.8%
Immigrants | Uganda
22.5
/100
|
#195
Fair
16.8%
Immigrants | Lebanon
22.0
/100
|
#196
Fair
16.8%
Immigrants | Kenya
19.1
/100
|
#197
Poor
16.9%
Delaware
17.1
/100
|
#198
Poor
17.0%
Immigrants | Afghanistan
15.1
/100
|
#199
Poor
17.0%
Immigrants | Cameroon
14.7
/100
|
#200
Poor
17.1%
Immigrants | Uzbekistan
14.7
/100
|
#201
Poor
17.1%
Ugandans
14.3
/100
|
#202
Poor
17.1%
Immigrants | Sierra Leone
14.2
/100
|
#203
Poor
17.1%

Demographics Similar to Immigrants from Cuba by Child Poverty Under the Age of 16

In terms of child poverty under the age of 16, the demographic groups most similar to Immigrants from Cuba are Cape Verdean (18.7%, a difference of 0.070%), Immigrants from Laos (18.7%, a difference of 0.13%), Alsatian (18.6%, a difference of 0.25%), Ghanaian (18.6%, a difference of 0.71%), and Shoshone (18.8%, a difference of 0.72%).
DemographicsRating | RankChild Poverty Under the Age of 16
Cree
0.9
/100
|
#236
Tragic
18.5%
Sudanese
0.9
/100
|
#237
Tragic
18.5%
Immigrants | Eritrea
0.8
/100
|
#238
Tragic
18.5%
Immigrants | Sudan
0.8
/100
|
#239
Tragic
18.5%
Ghanaians
0.8
/100
|
#240
Tragic
18.6%
Alsatians
0.7
/100
|
#241
Tragic
18.6%
Immigrants | Laos
0.6
/100
|
#242
Tragic
18.7%
Immigrants | Cuba
0.6
/100
|
#243
Tragic
18.7%
Cape Verdeans
0.6
/100
|
#244
Tragic
18.7%
Shoshone
0.5
/100
|
#245
Tragic
18.8%
Immigrants | Nicaragua
0.4
/100
|
#246
Tragic
18.8%
French American Indians
0.4
/100
|
#247
Tragic
18.9%
Ecuadorians
0.3
/100
|
#248
Tragic
19.0%
Potawatomi
0.3
/100
|
#249
Tragic
19.0%
Immigrants | Middle Africa
0.3
/100
|
#250
Tragic
19.0%