Immigrants from Latvia vs Immigrants from Burma/Myanmar Female Poverty Among 18-24 Year Olds

COMPARE

Immigrants from Latvia
Race
Ancestry
AfghanAfricanAlaska NativeAlaskan AthabascanAlbanianAleutAlsatianAmericanApacheArabArapahoArgentineanArmenianAssyrian/Chaldean/SyriacAustralianAustrianBahamianBangladeshiBarbadianBasqueBelgianBelizeanBermudanBhutaneseBlackfeetBolivianBrazilianBritishBritish West IndianBulgarianBurmeseCajunCambodianCanadianCape VerdeanCarpatho RusynCelticCentral AmericanCentral American IndianCherokeeCheyenneChickasawChileanChineseChippewaChoctawColombianColvilleComancheCosta RicanCreeCreekCroatianCrowCubanCypriotCzechCzechoslovakianDanishDelawareDominicanDutchDutch West IndianEastern EuropeanEcuadorianEgyptianEnglishEstonianEthiopianEuropeanFijianFilipinoFinnishFrenchFrench American IndianFrench CanadianGermanGerman RussianGhanaianGreekGuamanian/ChamorroGuatemalanGuyaneseHaitianHmongHonduranHopiHoumaHungarianIcelanderIndian (Asian)IndonesianInupiatIranianIraqiIrishIroquoisIsraeliItalianJamaicanJapaneseJordanianKenyanKiowaKoreanLaotianLatvianLebaneseLiberianLithuanianLumbeeLuxembourgerMacedonianMalaysianMalteseMarshalleseMenomineeMexicanMexican American IndianMongolianMoroccanNative HawaiianNavajoNepaleseNew ZealanderNicaraguanNigerianNorthern EuropeanNorwegianOkinawanOsageOttawaPaiutePakistaniPalestinianPanamanianParaguayanPennsylvania GermanPeruvianPimaPolishPortuguesePotawatomiPuebloPuerto RicanPuget Sound SalishRomanianRussianSalvadoranSamoanScandinavianScotch-IrishScottishSeminoleSenegaleseSerbianShoshoneSierra LeoneanSiouxSlavicSlovakSloveneSomaliSouth AfricanSouth AmericanSouth American IndianSoviet UnionSpaniardSpanishSpanish AmericanSpanish American IndianSri LankanSubsaharan AfricanSudaneseSwedishSwissSyrianTaiwaneseThaiTlingit-HaidaTohono O'OdhamTonganTrinidadian and TobagonianTsimshianTurkishU.S. Virgin IslanderUgandanUkrainianUruguayanUteVenezuelanVietnameseWelshWest IndianYakamaYaquiYugoslavianYumanYup'ikZimbabwean
Immigration
NonimmigrantsImmigrantsAfghanistanAfricaAlbaniaArgentinaArmeniaAsiaAustraliaAustriaBahamasBangladeshBarbadosBelarusBelgiumBelizeBoliviaBosnia and HerzegovinaBrazilBulgariaCabo VerdeCambodiaCameroonCanadaCaribbeanCentral AmericaChileChinaColombiaCongoCosta RicaCroatiaCubaCzechoslovakiaDenmarkDominicaDominican RepublicEastern AfricaEastern AsiaEastern EuropeEcuadorEgyptEl SalvadorEnglandEritreaEthiopiaEuropeFijiFranceGermanyGhanaGreeceGrenadaGuatemalaGuyanaHaitiHondurasHong KongHungaryIndiaIndonesiaIranIraqIrelandIsraelItalyJamaicaJapanJordanKazakhstanKenyaKoreaKuwaitLaosLatin AmericaLatviaLebanonLiberiaLithuaniaMalaysiaMexicoMicronesiaMiddle AfricaMoldovaMoroccoNepalNetherlandsNicaraguaNigeriaNorth AmericaNorth MacedoniaNorthern AfricaNorthern EuropeNorwayOceaniaPakistanPanamaPeruPhilippinesPolandPortugalRomaniaRussiaSaudi ArabiaScotlandSenegalSerbiaSierra LeoneSingaporeSomaliaSouth AfricaSouth AmericaSouth Central AsiaSouth Eastern AsiaSouthern EuropeSpainSri LankaSt. Vincent and the GrenadinesSudanSwedenSwitzerlandSyriaTaiwanThailandTrinidad and TobagoTurkeyUgandaUkraineUruguayUzbekistanVenezuelaVietnamWest IndiesWestern AfricaWestern AsiaWestern EuropeYemenZaireZimbabweAzores
Immigrants from Burma/Myanmar
Race
Ancestry
AfghanAfricanAlaska NativeAlaskan AthabascanAlbanianAleutAlsatianAmericanApacheArabArapahoArgentineanArmenianAssyrian/Chaldean/SyriacAustralianAustrianBahamianBangladeshiBarbadianBasqueBelgianBelizeanBermudanBhutaneseBlackfeetBolivianBrazilianBritishBritish West IndianBulgarianBurmeseCajunCambodianCanadianCape VerdeanCarpatho RusynCelticCentral AmericanCentral American IndianCherokeeCheyenneChickasawChileanChineseChippewaChoctawColombianColvilleComancheCosta RicanCreeCreekCroatianCrowCubanCypriotCzechCzechoslovakianDanishDelawareDominicanDutchDutch West IndianEastern EuropeanEcuadorianEgyptianEnglishEstonianEthiopianEuropeanFijianFilipinoFinnishFrenchFrench American IndianFrench CanadianGermanGerman RussianGhanaianGreekGuamanian/ChamorroGuatemalanGuyaneseHaitianHmongHonduranHopiHoumaHungarianIcelanderIndian (Asian)IndonesianInupiatIranianIraqiIrishIroquoisIsraeliItalianJamaicanJapaneseJordanianKenyanKiowaKoreanLaotianLatvianLebaneseLiberianLithuanianLumbeeLuxembourgerMacedonianMalaysianMalteseMarshalleseMenomineeMexicanMexican American IndianMongolianMoroccanNative HawaiianNavajoNepaleseNew ZealanderNicaraguanNigerianNorthern EuropeanNorwegianOkinawanOsageOttawaPaiutePakistaniPalestinianPanamanianParaguayanPennsylvania GermanPeruvianPimaPolishPortuguesePotawatomiPuebloPuerto RicanPuget Sound SalishRomanianRussianSalvadoranSamoanScandinavianScotch-IrishScottishSeminoleSenegaleseSerbianShoshoneSierra LeoneanSiouxSlavicSlovakSloveneSomaliSouth AfricanSouth AmericanSouth American IndianSoviet UnionSpaniardSpanishSpanish AmericanSpanish American IndianSri LankanSubsaharan AfricanSudaneseSwedishSwissSyrianTaiwaneseThaiTlingit-HaidaTohono O'OdhamTonganTrinidadian and TobagonianTsimshianTurkishU.S. Virgin IslanderUgandanUkrainianUruguayanUteVenezuelanVietnameseWelshWest IndianYakamaYaquiYugoslavianYumanYup'ikZimbabwean
Immigration
NonimmigrantsImmigrantsAfghanistanAfricaAlbaniaArgentinaArmeniaAsiaAustraliaAustriaBahamasBangladeshBarbadosBelarusBelgiumBelizeBoliviaBosnia and HerzegovinaBrazilBulgariaBurma/MyanmarCabo VerdeCambodiaCameroonCanadaCaribbeanCentral AmericaChileChinaColombiaCongoCosta RicaCroatiaCubaCzechoslovakiaDenmarkDominicaDominican RepublicEastern AfricaEastern AsiaEastern EuropeEcuadorEgyptEl SalvadorEnglandEritreaEthiopiaEuropeFijiFranceGermanyGhanaGreeceGrenadaGuatemalaGuyanaHaitiHondurasHong KongHungaryIndiaIndonesiaIranIraqIrelandIsraelItalyJamaicaJapanJordanKazakhstanKenyaKoreaKuwaitLaosLatin AmericaLebanonLiberiaLithuaniaMalaysiaMexicoMicronesiaMiddle AfricaMoldovaMoroccoNepalNetherlandsNicaraguaNigeriaNorth AmericaNorth MacedoniaNorthern AfricaNorthern EuropeNorwayOceaniaPakistanPanamaPeruPhilippinesPolandPortugalRomaniaRussiaSaudi ArabiaScotlandSenegalSerbiaSierra LeoneSingaporeSomaliaSouth AfricaSouth AmericaSouth Central AsiaSouth Eastern AsiaSouthern EuropeSpainSri LankaSt. Vincent and the GrenadinesSudanSwedenSwitzerlandSyriaTaiwanThailandTrinidad and TobagoTurkeyUgandaUkraineUruguayUzbekistanVenezuelaVietnamWest IndiesWestern AfricaWestern AsiaWestern EuropeYemenZaireZimbabweAzores
Female Poverty Among 18-24 Year Olds
Income
Poverty
Unemployment
Labor Participation
Family Structure
Vehicle Availability
Education Level
Disability

Female Poverty Among 18-24 Year Olds Comparison

Immigrants from Latvia

Immigrants from Burma/Myanmar

Fair
Tragic
20.4%
FEMALE POVERTY AMONG 18-24 YEAR OLDS
23.0/ 100
METRIC RATING
195th/ 347
METRIC RANK
21.6%
FEMALE POVERTY AMONG 18-24 YEAR OLDS
0.2/ 100
METRIC RATING
268th/ 347
METRIC RANK

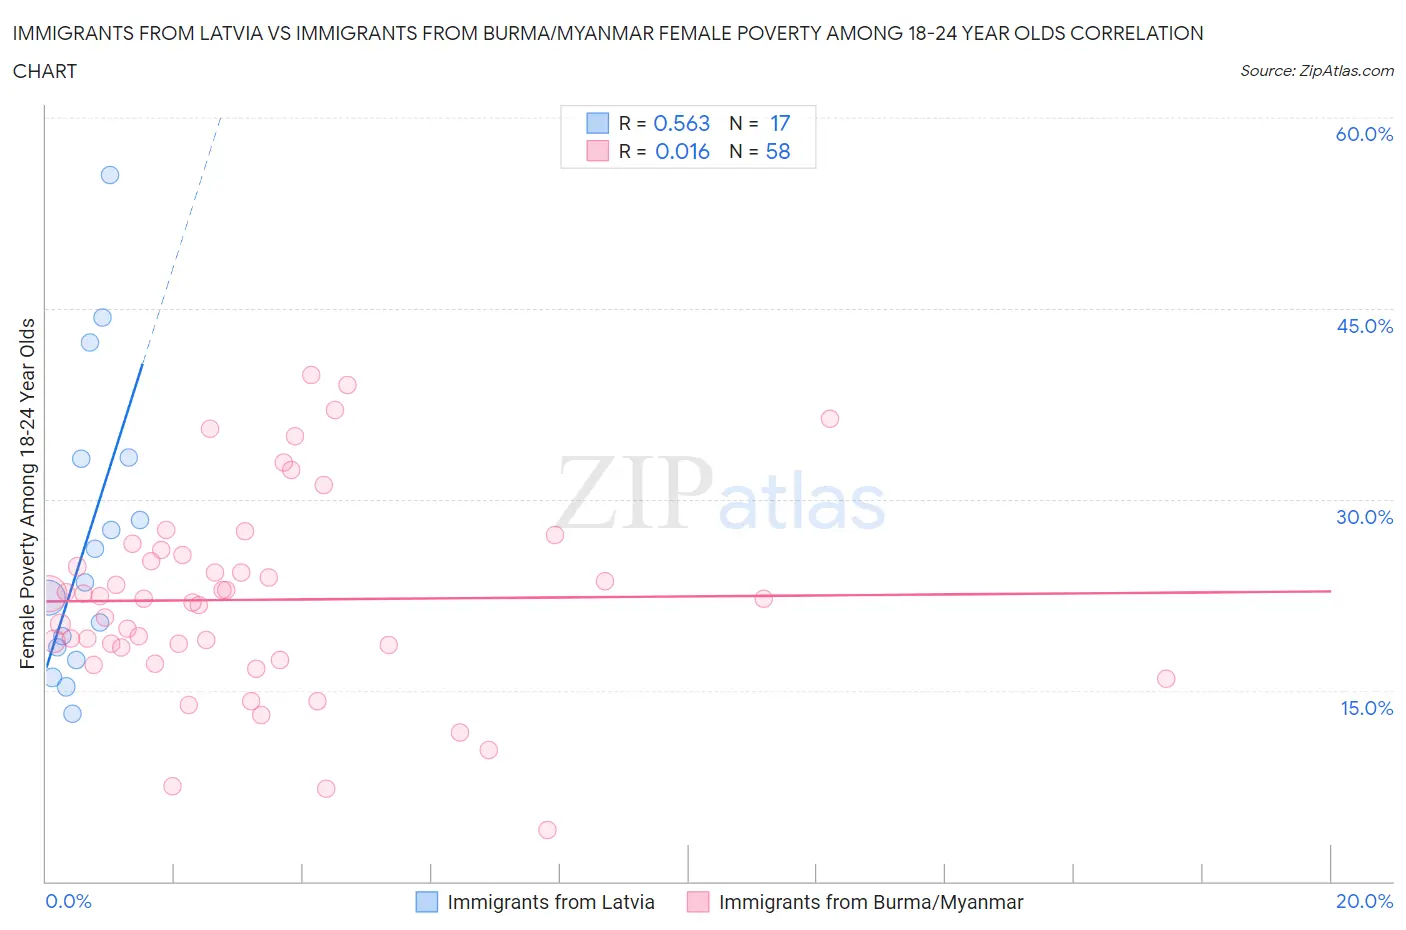
Immigrants from Latvia vs Immigrants from Burma/Myanmar Female Poverty Among 18-24 Year Olds Correlation Chart

The statistical analysis conducted on geographies consisting of 112,426,686 people shows a substantial positive correlation between the proportion of Immigrants from Latvia and poverty level among females between the ages 18 and 24 in the United States with a correlation coefficient (R) of 0.563 and weighted average of 20.4%. Similarly, the statistical analysis conducted on geographies consisting of 170,928,474 people shows no correlation between the proportion of Immigrants from Burma/Myanmar and poverty level among females between the ages 18 and 24 in the United States with a correlation coefficient (R) of 0.016 and weighted average of 21.6%, a difference of 5.8%.
Immigrants from Latvia vs Immigrants from Burma/Myanmar Female Poverty Among 18-24 Year Olds

Female Poverty Among 18-24 Year Olds Correlation Summary

MeasurementImmigrants from LatviaImmigrants from Burma/Myanmar
Minimum13.2%4.1%
Maximum55.5%39.8%
Range42.3%35.7%
Mean26.8%22.1%
Median23.5%22.2%
Interquartile 25% (IQ1)17.9%18.4%
Interquartile 75% (IQ3)33.3%25.6%
Interquartile Range (IQR)15.4%7.2%
Standard Deviation (Sample)11.7%7.7%
Standard Deviation (Population)11.3%7.6%

Similar Demographics by Female Poverty Among 18-24 Year Olds

Demographics Similar to Immigrants from Latvia by Female Poverty Among 18-24 Year Olds

In terms of female poverty among 18-24 year olds, the demographic groups most similar to Immigrants from Latvia are Mexican American Indian (20.4%, a difference of 0.010%), Nigerian (20.4%, a difference of 0.030%), Czech (20.4%, a difference of 0.050%), Immigrants from Israel (20.4%, a difference of 0.10%), and Zimbabwean (20.4%, a difference of 0.14%).
DemographicsRating | RankFemale Poverty Among 18-24 Year Olds
Scandinavians
34.6
/100
|
#188
Fair
20.3%
Immigrants | Germany
34.0
/100
|
#189
Fair
20.3%
Immigrants | Western Asia
29.3
/100
|
#190
Fair
20.3%
Moroccans
25.8
/100
|
#191
Fair
20.4%
Immigrants | Israel
24.4
/100
|
#192
Fair
20.4%
Nigerians
23.4
/100
|
#193
Fair
20.4%
Mexican American Indians
23.2
/100
|
#194
Fair
20.4%
Immigrants | Latvia
23.0
/100
|
#195
Fair
20.4%
Czechs
22.3
/100
|
#196
Fair
20.4%
Zimbabweans
21.0
/100
|
#197
Fair
20.4%
Immigrants | Spain
20.7
/100
|
#198
Fair
20.4%
Germans
20.6
/100
|
#199
Fair
20.4%
Europeans
19.9
/100
|
#200
Poor
20.4%
Mexicans
18.3
/100
|
#201
Poor
20.5%
Immigrants | Turkey
17.7
/100
|
#202
Poor
20.5%

Demographics Similar to Immigrants from Burma/Myanmar by Female Poverty Among 18-24 Year Olds

In terms of female poverty among 18-24 year olds, the demographic groups most similar to Immigrants from Burma/Myanmar are Celtic (21.6%, a difference of 0.060%), Mongolian (21.6%, a difference of 0.090%), Scotch-Irish (21.6%, a difference of 0.10%), American (21.6%, a difference of 0.15%), and Alaska Native (21.5%, a difference of 0.23%).
DemographicsRating | RankFemale Poverty Among 18-24 Year Olds
Immigrants | Bahamas
0.5
/100
|
#261
Tragic
21.4%
Immigrants | Eastern Africa
0.4
/100
|
#262
Tragic
21.4%
Icelanders
0.3
/100
|
#263
Tragic
21.5%
Hondurans
0.3
/100
|
#264
Tragic
21.5%
Immigrants | Nonimmigrants
0.3
/100
|
#265
Tragic
21.5%
Alaska Natives
0.3
/100
|
#266
Tragic
21.5%
Americans
0.3
/100
|
#267
Tragic
21.6%
Immigrants | Burma/Myanmar
0.2
/100
|
#268
Tragic
21.6%
Celtics
0.2
/100
|
#269
Tragic
21.6%
Mongolians
0.2
/100
|
#270
Tragic
21.6%
Scotch-Irish
0.2
/100
|
#271
Tragic
21.6%
Basques
0.2
/100
|
#272
Tragic
21.7%
New Zealanders
0.2
/100
|
#273
Tragic
21.7%
Immigrants | Honduras
0.1
/100
|
#274
Tragic
21.8%
Immigrants | Bangladesh
0.1
/100
|
#275
Tragic
21.8%