Immigrants from Latin America vs Portuguese Seniors Poverty Over the Age of 65
COMPARE
Immigrants from Latin America
Portuguese
Seniors Poverty Over the Age of 65
Seniors Poverty Over the Age of 65 Comparison
Immigrants from Latin America
Portuguese
14.2%
SENIORS POVERTY OVER THE AGE OF 65
0.0/ 100
METRIC RATING
306th/ 347
METRIC RANK
10.5%
SENIORS POVERTY OVER THE AGE OF 65
84.1/ 100
METRIC RATING
139th/ 347
METRIC RANK
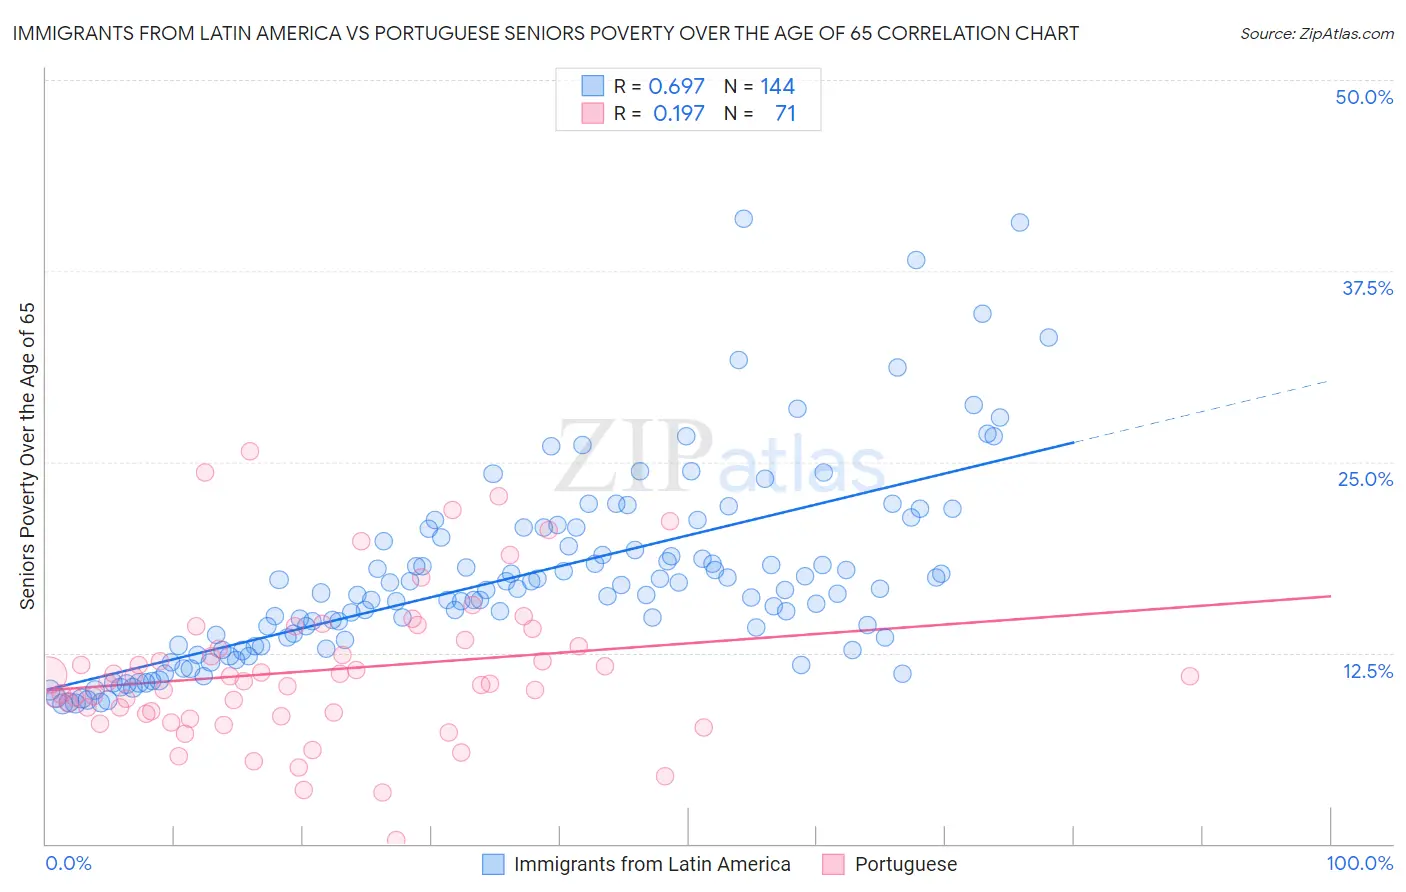
Immigrants from Latin America vs Portuguese Seniors Poverty Over the Age of 65 Correlation Chart
The statistical analysis conducted on geographies consisting of 554,058,835 people shows a significant positive correlation between the proportion of Immigrants from Latin America and poverty level among seniors over the age of 65 in the United States with a correlation coefficient (R) of 0.697 and weighted average of 14.2%. Similarly, the statistical analysis conducted on geographies consisting of 447,984,891 people shows a poor positive correlation between the proportion of Portuguese and poverty level among seniors over the age of 65 in the United States with a correlation coefficient (R) of 0.197 and weighted average of 10.5%, a difference of 34.4%.
Seniors Poverty Over the Age of 65 Correlation Summary
| Measurement | Immigrants from Latin America | Portuguese |
| Minimum | 9.2% | 0.21% |
| Maximum | 41.0% | 25.7% |
| Range | 31.8% | 25.5% |
| Mean | 17.4% | 11.3% |
| Median | 16.5% | 10.6% |
| Interquartile 25% (IQ1) | 13.0% | 8.5% |
| Interquartile 75% (IQ3) | 19.9% | 13.4% |
| Interquartile Range (IQR) | 7.0% | 4.8% |
| Standard Deviation (Sample) | 6.2% | 4.9% |
| Standard Deviation (Population) | 6.2% | 4.9% |
Similar Demographics by Seniors Poverty Over the Age of 65
Demographics Similar to Immigrants from Latin America by Seniors Poverty Over the Age of 65
In terms of seniors poverty over the age of 65, the demographic groups most similar to Immigrants from Latin America are Immigrants from West Indies (14.2%, a difference of 0.14%), Trinidadian and Tobagonian (14.2%, a difference of 0.21%), Immigrants from Trinidad and Tobago (14.1%, a difference of 0.30%), Honduran (14.2%, a difference of 0.31%), and West Indian (14.1%, a difference of 0.36%).
| Demographics | Rating | Rank | Seniors Poverty Over the Age of 65 |
| Ecuadorians | 0.0 /100 | #299 | Tragic 14.0% |
| Immigrants | Uzbekistan | 0.0 /100 | #300 | Tragic 14.0% |
| U.S. Virgin Islanders | 0.0 /100 | #301 | Tragic 14.0% |
| Yup'ik | 0.0 /100 | #302 | Tragic 14.1% |
| Immigrants | Bangladesh | 0.0 /100 | #303 | Tragic 14.1% |
| West Indians | 0.0 /100 | #304 | Tragic 14.1% |
| Immigrants | Trinidad and Tobago | 0.0 /100 | #305 | Tragic 14.1% |
| Immigrants | Latin America | 0.0 /100 | #306 | Tragic 14.2% |
| Immigrants | West Indies | 0.0 /100 | #307 | Tragic 14.2% |
| Trinidadians and Tobagonians | 0.0 /100 | #308 | Tragic 14.2% |
| Hondurans | 0.0 /100 | #309 | Tragic 14.2% |
| Bahamians | 0.0 /100 | #310 | Tragic 14.2% |
| Natives/Alaskans | 0.0 /100 | #311 | Tragic 14.2% |
| Hispanics or Latinos | 0.0 /100 | #312 | Tragic 14.3% |
| Barbadians | 0.0 /100 | #313 | Tragic 14.4% |
Demographics Similar to Portuguese by Seniors Poverty Over the Age of 65
In terms of seniors poverty over the age of 65, the demographic groups most similar to Portuguese are Immigrants from Latvia (10.5%, a difference of 0.10%), Immigrants from Kenya (10.5%, a difference of 0.13%), Immigrants from Europe (10.5%, a difference of 0.15%), Immigrants from Australia (10.5%, a difference of 0.16%), and Osage (10.6%, a difference of 0.22%).
| Demographics | Rating | Rank | Seniors Poverty Over the Age of 65 |
| Immigrants | Turkey | 87.7 /100 | #132 | Excellent 10.5% |
| Guamanians/Chamorros | 87.5 /100 | #133 | Excellent 10.5% |
| Sierra Leoneans | 86.8 /100 | #134 | Excellent 10.5% |
| Immigrants | Norway | 86.5 /100 | #135 | Excellent 10.5% |
| Immigrants | Serbia | 86.4 /100 | #136 | Excellent 10.5% |
| Immigrants | Australia | 85.1 /100 | #137 | Excellent 10.5% |
| Immigrants | Latvia | 84.7 /100 | #138 | Excellent 10.5% |
| Portuguese | 84.1 /100 | #139 | Excellent 10.5% |
| Immigrants | Kenya | 83.4 /100 | #140 | Excellent 10.5% |
| Immigrants | Europe | 83.3 /100 | #141 | Excellent 10.5% |
| Osage | 82.8 /100 | #142 | Excellent 10.6% |
| Immigrants | Asia | 80.8 /100 | #143 | Excellent 10.6% |
| Iraqis | 80.7 /100 | #144 | Excellent 10.6% |
| Laotians | 79.9 /100 | #145 | Good 10.6% |
| Alaskan Athabascans | 79.1 /100 | #146 | Good 10.6% |