Immigrants from Latin America vs Danish Single Father Poverty

COMPARE

Immigrants from Latin America
Race
Ancestry
AfghanAfricanAlaska NativeAlaskan AthabascanAlbanianAleutAlsatianAmericanApacheArabArapahoArgentineanArmenianAssyrian/Chaldean/SyriacAustralianAustrianBahamianBangladeshiBarbadianBasqueBelgianBelizeanBermudanBhutaneseBlackfeetBolivianBrazilianBritishBritish West IndianBulgarianBurmeseCajunCambodianCanadianCape VerdeanCarpatho RusynCelticCentral AmericanCentral American IndianCherokeeCheyenneChickasawChileanChineseChippewaChoctawColombianColvilleComancheCosta RicanCreeCreekCroatianCrowCubanCypriotCzechCzechoslovakianDelawareDominicanDutchDutch West IndianEastern EuropeanEcuadorianEgyptianEnglishEstonianEthiopianEuropeanFijianFilipinoFinnishFrenchFrench American IndianFrench CanadianGermanGerman RussianGhanaianGreekGuamanian/ChamorroGuatemalanGuyaneseHaitianHmongHonduranHopiHoumaHungarianIcelanderIndian (Asian)IndonesianInupiatIranianIraqiIrishIroquoisIsraeliItalianJamaicanJapaneseJordanianKenyanKiowaKoreanLaotianLatvianLebaneseLiberianLithuanianLumbeeLuxembourgerMacedonianMalaysianMalteseMarshalleseMenomineeMexicanMexican American IndianMongolianMoroccanNative HawaiianNavajoNepaleseNew ZealanderNicaraguanNigerianNorthern EuropeanNorwegianOkinawanOsageOttawaPaiutePakistaniPalestinianPanamanianParaguayanPennsylvania GermanPeruvianPimaPolishPortuguesePotawatomiPuebloPuerto RicanPuget Sound SalishRomanianRussianSalvadoranSamoanScandinavianScotch-IrishScottishSeminoleSenegaleseSerbianShoshoneSierra LeoneanSiouxSlavicSlovakSloveneSomaliSouth AfricanSouth AmericanSouth American IndianSoviet UnionSpaniardSpanishSpanish AmericanSpanish American IndianSri LankanSubsaharan AfricanSudaneseSwedishSwissSyrianTaiwaneseThaiTlingit-HaidaTohono O'OdhamTonganTrinidadian and TobagonianTsimshianTurkishU.S. Virgin IslanderUgandanUkrainianUruguayanUteVenezuelanVietnameseWelshWest IndianYakamaYaquiYugoslavianYumanYup'ikZimbabwean
Immigration
NonimmigrantsImmigrantsAfghanistanAfricaAlbaniaArgentinaArmeniaAsiaAustraliaAustriaBahamasBangladeshBarbadosBelarusBelgiumBelizeBoliviaBosnia and HerzegovinaBrazilBulgariaBurma/MyanmarCabo VerdeCambodiaCameroonCanadaCaribbeanCentral AmericaChileChinaColombiaCongoCosta RicaCroatiaCubaCzechoslovakiaDenmarkDominicaDominican RepublicEastern AfricaEastern AsiaEastern EuropeEcuadorEgyptEl SalvadorEnglandEritreaEthiopiaEuropeFijiFranceGermanyGhanaGreeceGrenadaGuatemalaGuyanaHaitiHondurasHong KongHungaryIndiaIndonesiaIranIraqIrelandIsraelItalyJamaicaJapanJordanKazakhstanKenyaKoreaKuwaitLaosLatin AmericaLatviaLebanonLiberiaLithuaniaMalaysiaMexicoMicronesiaMiddle AfricaMoldovaMoroccoNepalNetherlandsNicaraguaNigeriaNorth AmericaNorth MacedoniaNorthern AfricaNorthern EuropeNorwayOceaniaPakistanPanamaPeruPhilippinesPolandPortugalRomaniaRussiaSaudi ArabiaScotlandSenegalSerbiaSierra LeoneSingaporeSomaliaSouth AfricaSouth AmericaSouth Central AsiaSouth Eastern AsiaSouthern EuropeSpainSri LankaSt. Vincent and the GrenadinesSudanSwedenSwitzerlandSyriaTaiwanThailandTrinidad and TobagoTurkeyUgandaUkraineUruguayUzbekistanVenezuelaVietnamWest IndiesWestern AfricaWestern AsiaWestern EuropeYemenZaireZimbabweAzores
Danish
Race
Ancestry
AfghanAfricanAlaska NativeAlaskan AthabascanAlbanianAleutAlsatianAmericanApacheArabArapahoArgentineanArmenianAssyrian/Chaldean/SyriacAustralianAustrianBahamianBangladeshiBarbadianBasqueBelgianBelizeanBermudanBhutaneseBlackfeetBolivianBrazilianBritishBritish West IndianBulgarianBurmeseCajunCambodianCanadianCape VerdeanCarpatho RusynCelticCentral AmericanCentral American IndianCherokeeCheyenneChickasawChileanChineseChippewaChoctawColombianColvilleComancheCosta RicanCreeCreekCroatianCrowCubanCypriotCzechCzechoslovakianDanishDelawareDominicanDutchDutch West IndianEastern EuropeanEcuadorianEgyptianEnglishEstonianEthiopianEuropeanFijianFilipinoFinnishFrenchFrench American IndianFrench CanadianGermanGerman RussianGhanaianGreekGuamanian/ChamorroGuatemalanGuyaneseHaitianHmongHonduranHopiHoumaHungarianIcelanderIndian (Asian)IndonesianInupiatIranianIraqiIrishIroquoisIsraeliItalianJamaicanJapaneseJordanianKenyanKiowaKoreanLaotianLatvianLebaneseLiberianLithuanianLumbeeLuxembourgerMacedonianMalaysianMalteseMarshalleseMenomineeMexicanMexican American IndianMongolianMoroccanNative HawaiianNavajoNepaleseNew ZealanderNicaraguanNigerianNorthern EuropeanNorwegianOkinawanOsageOttawaPaiutePakistaniPalestinianPanamanianParaguayanPennsylvania GermanPeruvianPimaPolishPortuguesePotawatomiPuebloPuerto RicanPuget Sound SalishRomanianRussianSalvadoranSamoanScandinavianScotch-IrishScottishSeminoleSenegaleseSerbianShoshoneSierra LeoneanSiouxSlavicSlovakSloveneSomaliSouth AfricanSouth AmericanSouth American IndianSoviet UnionSpaniardSpanishSpanish AmericanSpanish American IndianSri LankanSubsaharan AfricanSudaneseSwedishSwissSyrianTaiwaneseThaiTlingit-HaidaTohono O'OdhamTonganTrinidadian and TobagonianTsimshianTurkishU.S. Virgin IslanderUgandanUkrainianUruguayanUteVenezuelanVietnameseWelshWest IndianYakamaYaquiYugoslavianYumanYup'ikZimbabwean
Immigration
NonimmigrantsImmigrantsAfghanistanAfricaAlbaniaArgentinaArmeniaAsiaAustraliaAustriaBahamasBangladeshBarbadosBelarusBelgiumBelizeBoliviaBosnia and HerzegovinaBrazilBulgariaBurma/MyanmarCabo VerdeCambodiaCameroonCanadaCaribbeanCentral AmericaChileChinaColombiaCongoCosta RicaCroatiaCubaCzechoslovakiaDenmarkDominicaDominican RepublicEastern AfricaEastern AsiaEastern EuropeEcuadorEgyptEl SalvadorEnglandEritreaEthiopiaEuropeFijiFranceGermanyGhanaGreeceGrenadaGuatemalaGuyanaHaitiHondurasHong KongHungaryIndiaIndonesiaIranIraqIrelandIsraelItalyJamaicaJapanJordanKazakhstanKenyaKoreaKuwaitLaosLatviaLebanonLiberiaLithuaniaMalaysiaMexicoMicronesiaMiddle AfricaMoldovaMoroccoNepalNetherlandsNicaraguaNigeriaNorth AmericaNorth MacedoniaNorthern AfricaNorthern EuropeNorwayOceaniaPakistanPanamaPeruPhilippinesPolandPortugalRomaniaRussiaSaudi ArabiaScotlandSenegalSerbiaSierra LeoneSingaporeSomaliaSouth AfricaSouth AmericaSouth Central AsiaSouth Eastern AsiaSouthern EuropeSpainSri LankaSt. Vincent and the GrenadinesSudanSwedenSwitzerlandSyriaTaiwanThailandTrinidad and TobagoTurkeyUgandaUkraineUruguayUzbekistanVenezuelaVietnamWest IndiesWestern AfricaWestern AsiaWestern EuropeYemenZaireZimbabweAzores
Single Father Poverty
Income
Poverty
Unemployment
Labor Participation
Family Structure
Vehicle Availability
Education Level
Disability

Single Father Poverty Comparison

Immigrants from Latin America

Danes

Fair
Exceptional
16.4%
SINGLE FATHER POVERTY
37.2/ 100
METRIC RATING
180th/ 347
METRIC RANK
15.8%
SINGLE FATHER POVERTY
94.5/ 100
METRIC RATING
113th/ 347
METRIC RANK

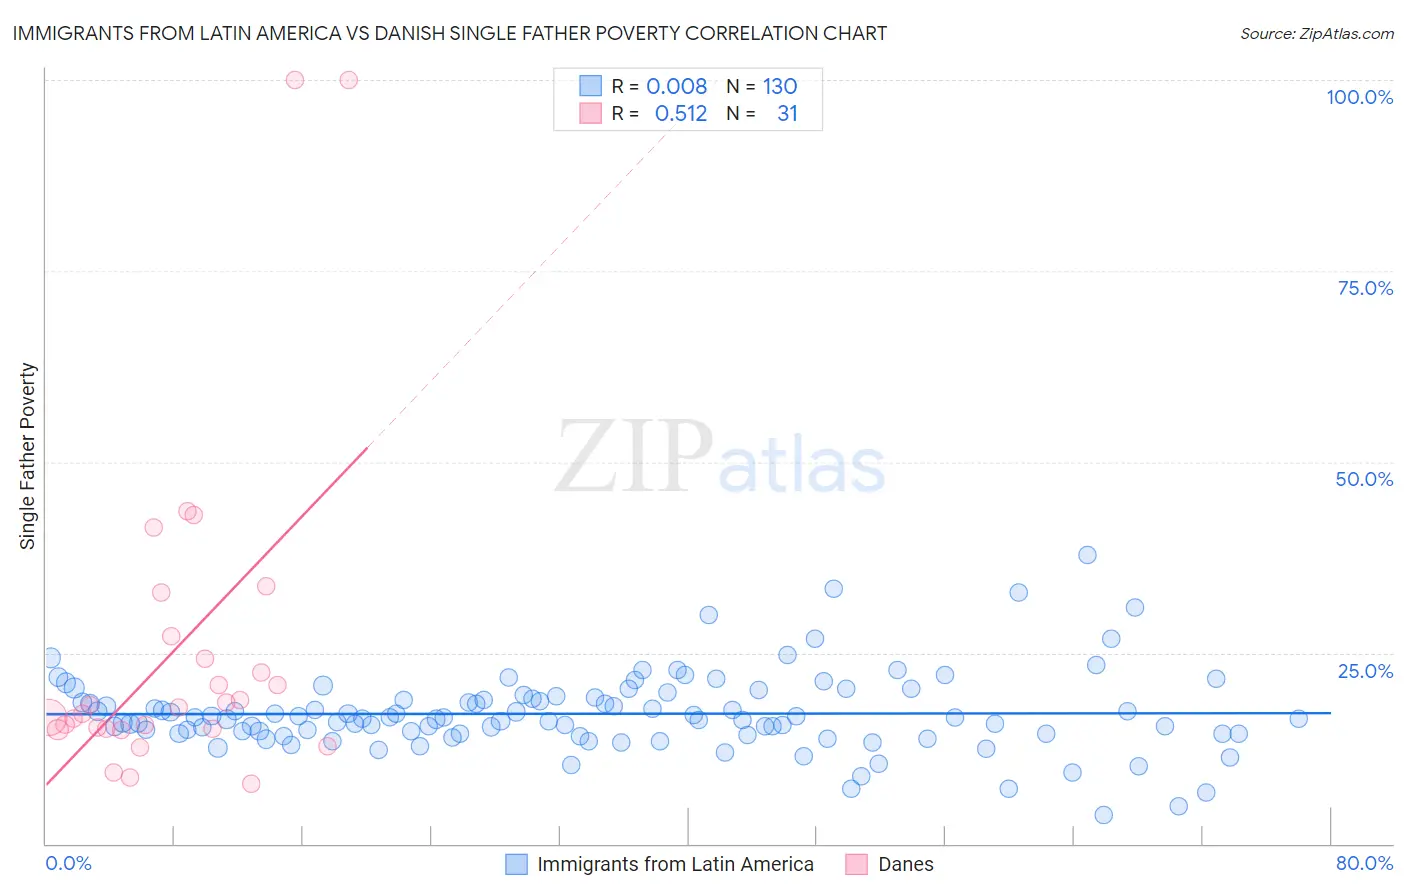
Immigrants from Latin America vs Danish Single Father Poverty Correlation Chart

The statistical analysis conducted on geographies consisting of 406,419,456 people shows no correlation between the proportion of Immigrants from Latin America and poverty level among single fathers in the United States with a correlation coefficient (R) of 0.008 and weighted average of 16.4%. Similarly, the statistical analysis conducted on geographies consisting of 352,960,899 people shows a substantial positive correlation between the proportion of Danes and poverty level among single fathers in the United States with a correlation coefficient (R) of 0.512 and weighted average of 15.8%, a difference of 3.8%.
Immigrants from Latin America vs Danish Single Father Poverty

Single Father Poverty Correlation Summary

MeasurementImmigrants from Latin AmericaDanish
Minimum3.7%7.9%
Maximum37.8%100.0%
Range34.0%92.1%
Mean17.0%25.5%
Median16.4%17.9%
Interquartile 25% (IQ1)14.4%15.1%
Interquartile 75% (IQ3)19.0%27.1%
Interquartile Range (IQR)4.6%12.0%
Standard Deviation (Sample)5.1%22.0%
Standard Deviation (Population)5.1%21.6%

Similar Demographics by Single Father Poverty

Demographics Similar to Immigrants from Latin America by Single Father Poverty

In terms of single father poverty, the demographic groups most similar to Immigrants from Latin America are Immigrants from Western Africa (16.4%, a difference of 0.060%), Immigrants from Italy (16.4%, a difference of 0.070%), Aleut (16.4%, a difference of 0.090%), Cambodian (16.4%, a difference of 0.12%), and Serbian (16.4%, a difference of 0.17%).
DemographicsRating | RankSingle Father Poverty
Immigrants | St. Vincent and the Grenadines
50.0
/100
|
#173
Average
16.3%
Swedes
50.0
/100
|
#174
Average
16.3%
Immigrants | Ecuador
49.7
/100
|
#175
Average
16.3%
Vietnamese
48.0
/100
|
#176
Average
16.3%
Immigrants | South Africa
44.2
/100
|
#177
Average
16.3%
Immigrants | Cuba
41.6
/100
|
#178
Average
16.4%
Serbians
40.9
/100
|
#179
Average
16.4%
Immigrants | Latin America
37.2
/100
|
#180
Fair
16.4%
Immigrants | Western Africa
36.0
/100
|
#181
Fair
16.4%
Immigrants | Italy
35.7
/100
|
#182
Fair
16.4%
Aleuts
35.3
/100
|
#183
Fair
16.4%
Cambodians
34.6
/100
|
#184
Fair
16.4%
Panamanians
33.6
/100
|
#185
Fair
16.4%
Immigrants | Venezuela
31.0
/100
|
#186
Fair
16.4%
Ukrainians
30.4
/100
|
#187
Fair
16.4%

Demographics Similar to Danes by Single Father Poverty

In terms of single father poverty, the demographic groups most similar to Danes are Argentinean (15.8%, a difference of 0.020%), Immigrants from Latvia (15.8%, a difference of 0.040%), Bulgarian (15.8%, a difference of 0.080%), Immigrants from Africa (15.8%, a difference of 0.13%), and Turkish (15.8%, a difference of 0.14%).
DemographicsRating | RankSingle Father Poverty
Immigrants | Poland
95.8
/100
|
#106
Exceptional
15.7%
Native Hawaiians
95.8
/100
|
#107
Exceptional
15.7%
Pakistanis
95.7
/100
|
#108
Exceptional
15.7%
Turks
95.1
/100
|
#109
Exceptional
15.8%
Immigrants | Africa
95.1
/100
|
#110
Exceptional
15.8%
Bulgarians
94.8
/100
|
#111
Exceptional
15.8%
Immigrants | Latvia
94.7
/100
|
#112
Exceptional
15.8%
Danes
94.5
/100
|
#113
Exceptional
15.8%
Argentineans
94.4
/100
|
#114
Exceptional
15.8%
Immigrants | Thailand
93.6
/100
|
#115
Exceptional
15.8%
Immigrants | Argentina
92.8
/100
|
#116
Exceptional
15.8%
Immigrants | Colombia
92.6
/100
|
#117
Exceptional
15.8%
Immigrants | Eastern Europe
92.5
/100
|
#118
Exceptional
15.8%
Immigrants | Belarus
92.4
/100
|
#119
Exceptional
15.8%
Uruguayans
92.1
/100
|
#120
Exceptional
15.9%