Immigrants from Laos vs Yuman Seniors Poverty Over the Age of 75

COMPARE

Immigrants from Laos
Race
Ancestry
AfghanAfricanAlaska NativeAlaskan AthabascanAlbanianAleutAlsatianAmericanApacheArabArapahoArgentineanArmenianAssyrian/Chaldean/SyriacAustralianAustrianBahamianBangladeshiBarbadianBasqueBelgianBelizeanBermudanBhutaneseBlackfeetBolivianBrazilianBritishBritish West IndianBulgarianBurmeseCajunCambodianCanadianCape VerdeanCarpatho RusynCelticCentral AmericanCentral American IndianCherokeeCheyenneChickasawChileanChineseChippewaChoctawColombianColvilleComancheCosta RicanCreeCreekCroatianCrowCubanCypriotCzechCzechoslovakianDanishDelawareDominicanDutchDutch West IndianEastern EuropeanEcuadorianEgyptianEnglishEstonianEthiopianEuropeanFijianFilipinoFinnishFrenchFrench American IndianFrench CanadianGermanGerman RussianGhanaianGreekGuamanian/ChamorroGuatemalanGuyaneseHaitianHmongHonduranHopiHoumaHungarianIcelanderIndian (Asian)IndonesianInupiatIranianIraqiIrishIroquoisIsraeliItalianJamaicanJapaneseJordanianKenyanKiowaKoreanLaotianLatvianLebaneseLiberianLithuanianLumbeeLuxembourgerMacedonianMalaysianMalteseMarshalleseMenomineeMexicanMexican American IndianMongolianMoroccanNative HawaiianNavajoNepaleseNew ZealanderNicaraguanNigerianNorthern EuropeanNorwegianOkinawanOsageOttawaPaiutePakistaniPalestinianPanamanianParaguayanPennsylvania GermanPeruvianPimaPolishPortuguesePotawatomiPuebloPuerto RicanPuget Sound SalishRomanianRussianSalvadoranSamoanScandinavianScotch-IrishScottishSeminoleSenegaleseSerbianShoshoneSierra LeoneanSiouxSlavicSlovakSloveneSomaliSouth AfricanSouth AmericanSouth American IndianSoviet UnionSpaniardSpanishSpanish AmericanSpanish American IndianSri LankanSubsaharan AfricanSudaneseSwedishSwissSyrianTaiwaneseThaiTlingit-HaidaTohono O'OdhamTonganTrinidadian and TobagonianTsimshianTurkishU.S. Virgin IslanderUgandanUkrainianUruguayanUteVenezuelanVietnameseWelshWest IndianYakamaYaquiYugoslavianYup'ikZimbabwean
Immigration
NonimmigrantsImmigrantsAfghanistanAfricaAlbaniaArgentinaArmeniaAsiaAustraliaAustriaBahamasBangladeshBarbadosBelarusBelgiumBelizeBoliviaBosnia and HerzegovinaBrazilBulgariaBurma/MyanmarCabo VerdeCambodiaCameroonCanadaCaribbeanCentral AmericaChileChinaColombiaCongoCosta RicaCroatiaCubaCzechoslovakiaDenmarkDominicaDominican RepublicEastern AfricaEastern AsiaEastern EuropeEcuadorEgyptEl SalvadorEnglandEritreaEthiopiaEuropeFijiFranceGermanyGhanaGreeceGrenadaGuatemalaGuyanaHaitiHondurasHong KongHungaryIndiaIndonesiaIranIraqIrelandIsraelItalyJamaicaJapanJordanKazakhstanKenyaKoreaKuwaitLaosLatin AmericaLatviaLebanonLiberiaLithuaniaMalaysiaMexicoMicronesiaMiddle AfricaMoldovaMoroccoNepalNetherlandsNicaraguaNigeriaNorth AmericaNorth MacedoniaNorthern AfricaNorthern EuropeNorwayOceaniaPakistanPanamaPeruPhilippinesPolandPortugalRomaniaRussiaSaudi ArabiaScotlandSenegalSerbiaSierra LeoneSingaporeSomaliaSouth AfricaSouth AmericaSouth Central AsiaSouth Eastern AsiaSouthern EuropeSpainSri LankaSt. Vincent and the GrenadinesSudanSwedenSwitzerlandSyriaTaiwanThailandTrinidad and TobagoTurkeyUgandaUkraineUruguayUzbekistanVenezuelaVietnamWest IndiesWestern AfricaWestern AsiaWestern EuropeYemenZaireZimbabweAzores
Yuman
Race
Ancestry
AfghanAfricanAlaska NativeAlaskan AthabascanAlbanianAleutAlsatianAmericanApacheArabArapahoArgentineanArmenianAssyrian/Chaldean/SyriacAustralianAustrianBahamianBangladeshiBarbadianBasqueBelgianBelizeanBermudanBhutaneseBlackfeetBolivianBrazilianBritishBritish West IndianBulgarianBurmeseCajunCambodianCanadianCape VerdeanCarpatho RusynCelticCentral AmericanCentral American IndianCherokeeCheyenneChickasawChileanChineseChippewaChoctawColombianColvilleComancheCosta RicanCreeCreekCroatianCrowCubanCypriotCzechCzechoslovakianDanishDelawareDominicanDutchDutch West IndianEastern EuropeanEcuadorianEgyptianEnglishEstonianEthiopianEuropeanFijianFilipinoFinnishFrenchFrench American IndianFrench CanadianGermanGerman RussianGhanaianGreekGuamanian/ChamorroGuatemalanGuyaneseHaitianHmongHonduranHopiHoumaHungarianIcelanderIndian (Asian)IndonesianInupiatIranianIraqiIrishIroquoisIsraeliItalianJamaicanJapaneseJordanianKenyanKiowaKoreanLaotianLatvianLebaneseLiberianLithuanianLumbeeLuxembourgerMacedonianMalaysianMalteseMarshalleseMenomineeMexicanMexican American IndianMongolianMoroccanNative HawaiianNavajoNepaleseNew ZealanderNicaraguanNigerianNorthern EuropeanNorwegianOkinawanOsageOttawaPaiutePakistaniPalestinianPanamanianParaguayanPennsylvania GermanPeruvianPimaPolishPortuguesePotawatomiPuebloPuerto RicanPuget Sound SalishRomanianRussianSalvadoranSamoanScandinavianScotch-IrishScottishSeminoleSenegaleseSerbianShoshoneSierra LeoneanSiouxSlavicSlovakSloveneSomaliSouth AfricanSouth AmericanSouth American IndianSoviet UnionSpaniardSpanishSpanish AmericanSpanish American IndianSri LankanSubsaharan AfricanSudaneseSwedishSwissSyrianTaiwaneseThaiTlingit-HaidaTohono O'OdhamTonganTrinidadian and TobagonianTsimshianTurkishU.S. Virgin IslanderUgandanUkrainianUruguayanUteVenezuelanVietnameseWelshWest IndianYakamaYaquiYugoslavianYumanYup'ikZimbabwean
Immigration
NonimmigrantsImmigrantsAfghanistanAfricaAlbaniaArgentinaArmeniaAsiaAustraliaAustriaBahamasBangladeshBarbadosBelarusBelgiumBelizeBoliviaBosnia and HerzegovinaBrazilBulgariaBurma/MyanmarCabo VerdeCambodiaCameroonCanadaCaribbeanCentral AmericaChileChinaColombiaCongoCosta RicaCroatiaCubaCzechoslovakiaDenmarkDominicaDominican RepublicEastern AfricaEastern AsiaEastern EuropeEcuadorEgyptEl SalvadorEnglandEritreaEthiopiaEuropeFijiFranceGermanyGhanaGreeceGrenadaGuatemalaGuyanaHaitiHondurasHong KongHungaryIndiaIndonesiaIranIraqIrelandIsraelItalyJamaicaJapanJordanKazakhstanKenyaKoreaKuwaitLatin AmericaLatviaLebanonLiberiaLithuaniaMalaysiaMexicoMicronesiaMiddle AfricaMoldovaMoroccoNepalNetherlandsNicaraguaNigeriaNorth AmericaNorth MacedoniaNorthern AfricaNorthern EuropeNorwayOceaniaPakistanPanamaPeruPhilippinesPolandPortugalRomaniaRussiaSaudi ArabiaScotlandSenegalSerbiaSierra LeoneSingaporeSomaliaSouth AfricaSouth AmericaSouth Central AsiaSouth Eastern AsiaSouthern EuropeSpainSri LankaSt. Vincent and the GrenadinesSudanSwedenSwitzerlandSyriaTaiwanThailandTrinidad and TobagoTurkeyUgandaUkraineUruguayUzbekistanVenezuelaVietnamWest IndiesWestern AfricaWestern AsiaWestern EuropeYemenZaireZimbabweAzores
Seniors Poverty Over the Age of 75
Income
Poverty
Unemployment
Labor Participation
Family Structure
Vehicle Availability
Education Level
Disability

Seniors Poverty Over the Age of 75 Comparison

Immigrants from Laos

Yuman

Good
Tragic
12.0%
SENIORS POVERTY OVER THE AGE OF 75
71.5/ 100
METRIC RATING
142nd/ 347
METRIC RANK
15.4%
SENIORS POVERTY OVER THE AGE OF 75
0.0/ 100
METRIC RATING
296th/ 347
METRIC RANK

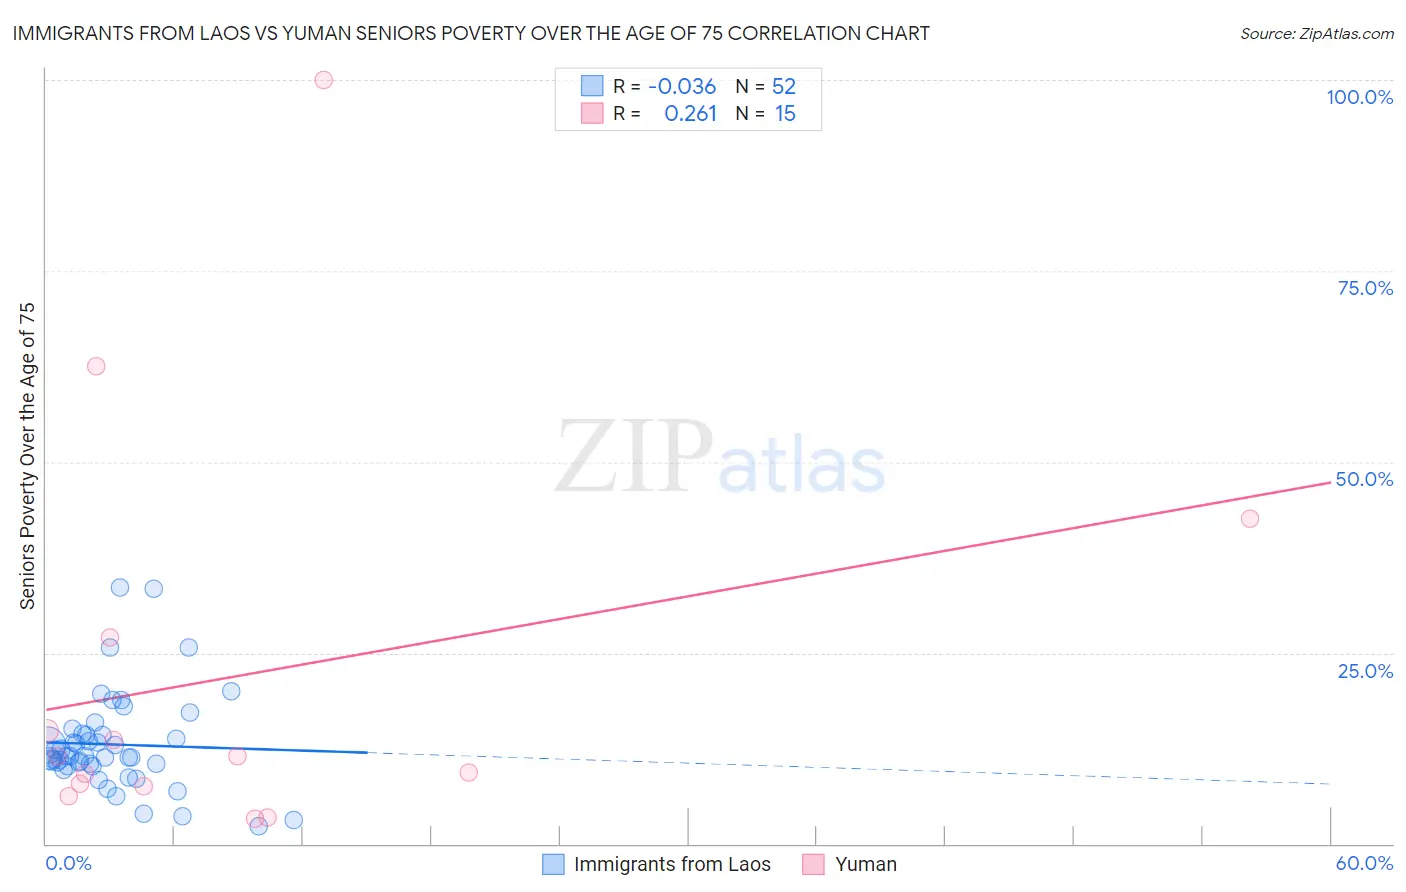
Immigrants from Laos vs Yuman Seniors Poverty Over the Age of 75 Correlation Chart

The statistical analysis conducted on geographies consisting of 200,379,282 people shows no correlation between the proportion of Immigrants from Laos and poverty level among seniors over the age of 75 in the United States with a correlation coefficient (R) of -0.036 and weighted average of 12.0%. Similarly, the statistical analysis conducted on geographies consisting of 40,581,367 people shows a weak positive correlation between the proportion of Yuman and poverty level among seniors over the age of 75 in the United States with a correlation coefficient (R) of 0.261 and weighted average of 15.4%, a difference of 28.8%.
Immigrants from Laos vs Yuman Seniors Poverty Over the Age of 75

Seniors Poverty Over the Age of 75 Correlation Summary

MeasurementImmigrants from LaosYuman
Minimum2.3%3.3%
Maximum33.6%100.0%
Range31.3%96.7%
Mean13.0%22.0%
Median11.4%11.5%
Interquartile 25% (IQ1)10.4%7.6%
Interquartile 75% (IQ3)14.3%27.0%
Interquartile Range (IQR)3.9%19.4%
Standard Deviation (Sample)6.3%27.0%
Standard Deviation (Population)6.2%26.1%

Similar Demographics by Seniors Poverty Over the Age of 75

Demographics Similar to Immigrants from Laos by Seniors Poverty Over the Age of 75

In terms of seniors poverty over the age of 75, the demographic groups most similar to Immigrants from Laos are Immigrants from Cameroon (12.0%, a difference of 0.030%), Immigrants from Pakistan (12.0%, a difference of 0.040%), American (12.0%, a difference of 0.050%), Hmong (12.0%, a difference of 0.060%), and Immigrants from Belgium (12.0%, a difference of 0.060%).
DemographicsRating | RankSeniors Poverty Over the Age of 75
Immigrants | Ireland
76.2
/100
|
#135
Good
11.9%
Immigrants | Philippines
75.0
/100
|
#136
Good
11.9%
Immigrants | Moldova
74.1
/100
|
#137
Good
11.9%
Immigrants | Romania
72.6
/100
|
#138
Good
11.9%
Immigrants | Kenya
72.6
/100
|
#139
Good
11.9%
Immigrants | Pakistan
71.9
/100
|
#140
Good
12.0%
Immigrants | Cameroon
71.7
/100
|
#141
Good
12.0%
Immigrants | Laos
71.5
/100
|
#142
Good
12.0%
Americans
71.0
/100
|
#143
Good
12.0%
Hmong
70.8
/100
|
#144
Good
12.0%
Immigrants | Belgium
70.8
/100
|
#145
Good
12.0%
Bangladeshis
70.4
/100
|
#146
Good
12.0%
Immigrants | Latvia
69.1
/100
|
#147
Good
12.0%
Immigrants | Zaire
67.6
/100
|
#148
Good
12.0%
Asians
67.4
/100
|
#149
Good
12.0%

Demographics Similar to Yuman by Seniors Poverty Over the Age of 75

In terms of seniors poverty over the age of 75, the demographic groups most similar to Yuman are U.S. Virgin Islander (15.4%, a difference of 0.18%), Honduran (15.4%, a difference of 0.28%), Immigrants from Jamaica (15.3%, a difference of 0.37%), Native/Alaskan (15.5%, a difference of 0.62%), and Spanish American Indian (15.5%, a difference of 0.72%).
DemographicsRating | RankSeniors Poverty Over the Age of 75
Immigrants | Belize
0.0
/100
|
#289
Tragic
15.2%
Immigrants | Azores
0.0
/100
|
#290
Tragic
15.2%
Paiute
0.0
/100
|
#291
Tragic
15.2%
Colville
0.0
/100
|
#292
Tragic
15.2%
Apache
0.0
/100
|
#293
Tragic
15.3%
Immigrants | Jamaica
0.0
/100
|
#294
Tragic
15.3%
U.S. Virgin Islanders
0.0
/100
|
#295
Tragic
15.4%
Yuman
0.0
/100
|
#296
Tragic
15.4%
Hondurans
0.0
/100
|
#297
Tragic
15.4%
Natives/Alaskans
0.0
/100
|
#298
Tragic
15.5%
Spanish American Indians
0.0
/100
|
#299
Tragic
15.5%
Bahamians
0.0
/100
|
#300
Tragic
15.5%
Immigrants | Latin America
0.0
/100
|
#301
Tragic
15.6%
West Indians
0.0
/100
|
#302
Tragic
15.7%
Immigrants | Honduras
0.0
/100
|
#303
Tragic
15.7%