Immigrants from Laos vs Assyrian/Chaldean/Syriac Poverty

COMPARE

Immigrants from Laos
Race
Ancestry
AfghanAfricanAlaska NativeAlaskan AthabascanAlbanianAleutAlsatianAmericanApacheArabArapahoArgentineanArmenianAustralianAustrianBahamianBangladeshiBarbadianBasqueBelgianBelizeanBermudanBhutaneseBlackfeetBolivianBrazilianBritishBritish West IndianBulgarianBurmeseCajunCambodianCanadianCape VerdeanCarpatho RusynCelticCentral AmericanCentral American IndianCherokeeCheyenneChickasawChileanChineseChippewaChoctawColombianColvilleComancheCosta RicanCreeCreekCroatianCrowCubanCypriotCzechCzechoslovakianDanishDelawareDominicanDutchDutch West IndianEastern EuropeanEcuadorianEgyptianEnglishEstonianEthiopianEuropeanFijianFilipinoFinnishFrenchFrench American IndianFrench CanadianGermanGerman RussianGhanaianGreekGuamanian/ChamorroGuatemalanGuyaneseHaitianHmongHonduranHopiHoumaHungarianIcelanderIndian (Asian)IndonesianInupiatIranianIraqiIrishIroquoisIsraeliItalianJamaicanJapaneseJordanianKenyanKiowaKoreanLaotianLatvianLebaneseLiberianLithuanianLumbeeLuxembourgerMacedonianMalaysianMalteseMarshalleseMenomineeMexicanMexican American IndianMongolianMoroccanNative HawaiianNavajoNepaleseNew ZealanderNicaraguanNigerianNorthern EuropeanNorwegianOkinawanOsageOttawaPaiutePakistaniPalestinianPanamanianParaguayanPennsylvania GermanPeruvianPimaPolishPortuguesePotawatomiPuebloPuerto RicanPuget Sound SalishRomanianRussianSalvadoranSamoanScandinavianScotch-IrishScottishSeminoleSenegaleseSerbianShoshoneSierra LeoneanSiouxSlavicSlovakSloveneSomaliSouth AfricanSouth AmericanSouth American IndianSoviet UnionSpaniardSpanishSpanish AmericanSpanish American IndianSri LankanSubsaharan AfricanSudaneseSwedishSwissSyrianTaiwaneseThaiTlingit-HaidaTohono O'OdhamTonganTrinidadian and TobagonianTsimshianTurkishU.S. Virgin IslanderUgandanUkrainianUruguayanUteVenezuelanVietnameseWelshWest IndianYakamaYaquiYugoslavianYumanYup'ikZimbabwean
Immigration
NonimmigrantsImmigrantsAfghanistanAfricaAlbaniaArgentinaArmeniaAsiaAustraliaAustriaBahamasBangladeshBarbadosBelarusBelgiumBelizeBoliviaBosnia and HerzegovinaBrazilBulgariaBurma/MyanmarCabo VerdeCambodiaCameroonCanadaCaribbeanCentral AmericaChileChinaColombiaCongoCosta RicaCroatiaCubaCzechoslovakiaDenmarkDominicaDominican RepublicEastern AfricaEastern AsiaEastern EuropeEcuadorEgyptEl SalvadorEnglandEritreaEthiopiaEuropeFijiFranceGermanyGhanaGreeceGrenadaGuatemalaGuyanaHaitiHondurasHong KongHungaryIndiaIndonesiaIranIraqIrelandIsraelItalyJamaicaJapanJordanKazakhstanKenyaKoreaKuwaitLaosLatin AmericaLatviaLebanonLiberiaLithuaniaMalaysiaMexicoMicronesiaMiddle AfricaMoldovaMoroccoNepalNetherlandsNicaraguaNigeriaNorth AmericaNorth MacedoniaNorthern AfricaNorthern EuropeNorwayOceaniaPakistanPanamaPeruPhilippinesPolandPortugalRomaniaRussiaSaudi ArabiaScotlandSenegalSerbiaSierra LeoneSingaporeSomaliaSouth AfricaSouth AmericaSouth Central AsiaSouth Eastern AsiaSouthern EuropeSpainSri LankaSt. Vincent and the GrenadinesSudanSwedenSwitzerlandSyriaTaiwanThailandTrinidad and TobagoTurkeyUgandaUkraineUruguayUzbekistanVenezuelaVietnamWest IndiesWestern AfricaWestern AsiaWestern EuropeYemenZaireZimbabweAzores
Assyrian/Chaldean/Syriac
Race
Ancestry
AfghanAfricanAlaska NativeAlaskan AthabascanAlbanianAleutAlsatianAmericanApacheArabArapahoArgentineanArmenianAssyrian/Chaldean/SyriacAustralianAustrianBahamianBangladeshiBarbadianBasqueBelgianBelizeanBermudanBhutaneseBlackfeetBolivianBrazilianBritishBritish West IndianBulgarianBurmeseCajunCambodianCanadianCape VerdeanCarpatho RusynCelticCentral AmericanCentral American IndianCherokeeCheyenneChickasawChileanChineseChippewaChoctawColombianColvilleComancheCosta RicanCreeCreekCroatianCrowCubanCypriotCzechCzechoslovakianDanishDelawareDominicanDutchDutch West IndianEastern EuropeanEcuadorianEgyptianEnglishEstonianEthiopianEuropeanFijianFilipinoFinnishFrenchFrench American IndianFrench CanadianGermanGerman RussianGhanaianGreekGuamanian/ChamorroGuatemalanGuyaneseHaitianHmongHonduranHopiHoumaHungarianIcelanderIndian (Asian)IndonesianInupiatIranianIraqiIrishIroquoisIsraeliItalianJamaicanJapaneseJordanianKenyanKiowaKoreanLaotianLatvianLebaneseLiberianLithuanianLumbeeLuxembourgerMacedonianMalaysianMalteseMarshalleseMenomineeMexicanMexican American IndianMongolianMoroccanNative HawaiianNavajoNepaleseNew ZealanderNicaraguanNigerianNorthern EuropeanNorwegianOkinawanOsageOttawaPaiutePakistaniPalestinianPanamanianParaguayanPennsylvania GermanPeruvianPimaPolishPortuguesePotawatomiPuebloPuerto RicanPuget Sound SalishRomanianRussianSalvadoranSamoanScandinavianScotch-IrishScottishSeminoleSenegaleseSerbianShoshoneSierra LeoneanSiouxSlavicSlovakSloveneSomaliSouth AfricanSouth AmericanSouth American IndianSoviet UnionSpaniardSpanishSpanish AmericanSpanish American IndianSri LankanSubsaharan AfricanSudaneseSwedishSwissSyrianTaiwaneseThaiTlingit-HaidaTohono O'OdhamTonganTrinidadian and TobagonianTsimshianTurkishU.S. Virgin IslanderUgandanUkrainianUruguayanUteVenezuelanVietnameseWelshWest IndianYakamaYaquiYugoslavianYumanYup'ikZimbabwean
Immigration
NonimmigrantsImmigrantsAfghanistanAfricaAlbaniaArgentinaArmeniaAsiaAustraliaAustriaBahamasBangladeshBarbadosBelarusBelgiumBelizeBoliviaBosnia and HerzegovinaBrazilBulgariaBurma/MyanmarCabo VerdeCambodiaCameroonCanadaCaribbeanCentral AmericaChileChinaColombiaCongoCosta RicaCroatiaCubaCzechoslovakiaDenmarkDominicaDominican RepublicEastern AfricaEastern AsiaEastern EuropeEcuadorEgyptEl SalvadorEnglandEritreaEthiopiaEuropeFijiFranceGermanyGhanaGreeceGrenadaGuatemalaGuyanaHaitiHondurasHong KongHungaryIndiaIndonesiaIranIraqIrelandIsraelItalyJamaicaJapanJordanKazakhstanKenyaKoreaKuwaitLatin AmericaLatviaLebanonLiberiaLithuaniaMalaysiaMexicoMicronesiaMiddle AfricaMoldovaMoroccoNepalNetherlandsNicaraguaNigeriaNorth AmericaNorth MacedoniaNorthern AfricaNorthern EuropeNorwayOceaniaPakistanPanamaPeruPhilippinesPolandPortugalRomaniaRussiaSaudi ArabiaScotlandSenegalSerbiaSierra LeoneSingaporeSomaliaSouth AfricaSouth AmericaSouth Central AsiaSouth Eastern AsiaSouthern EuropeSpainSri LankaSt. Vincent and the GrenadinesSudanSwedenSwitzerlandSyriaTaiwanThailandTrinidad and TobagoTurkeyUgandaUkraineUruguayUzbekistanVenezuelaVietnamWest IndiesWestern AfricaWestern AsiaWestern EuropeYemenZaireZimbabweAzores
Poverty
Income
Poverty
Unemployment
Labor Participation
Family Structure
Vehicle Availability
Education Level
Disability

Poverty Comparison

Immigrants from Laos

Assyrians/Chaldeans/Syriacs

Tragic
Exceptional
13.8%
POVERTY
0.7/ 100
METRIC RATING
234th/ 347
METRIC RANK
10.1%
POVERTY
99.9/ 100
METRIC RATING
6th/ 347
METRIC RANK

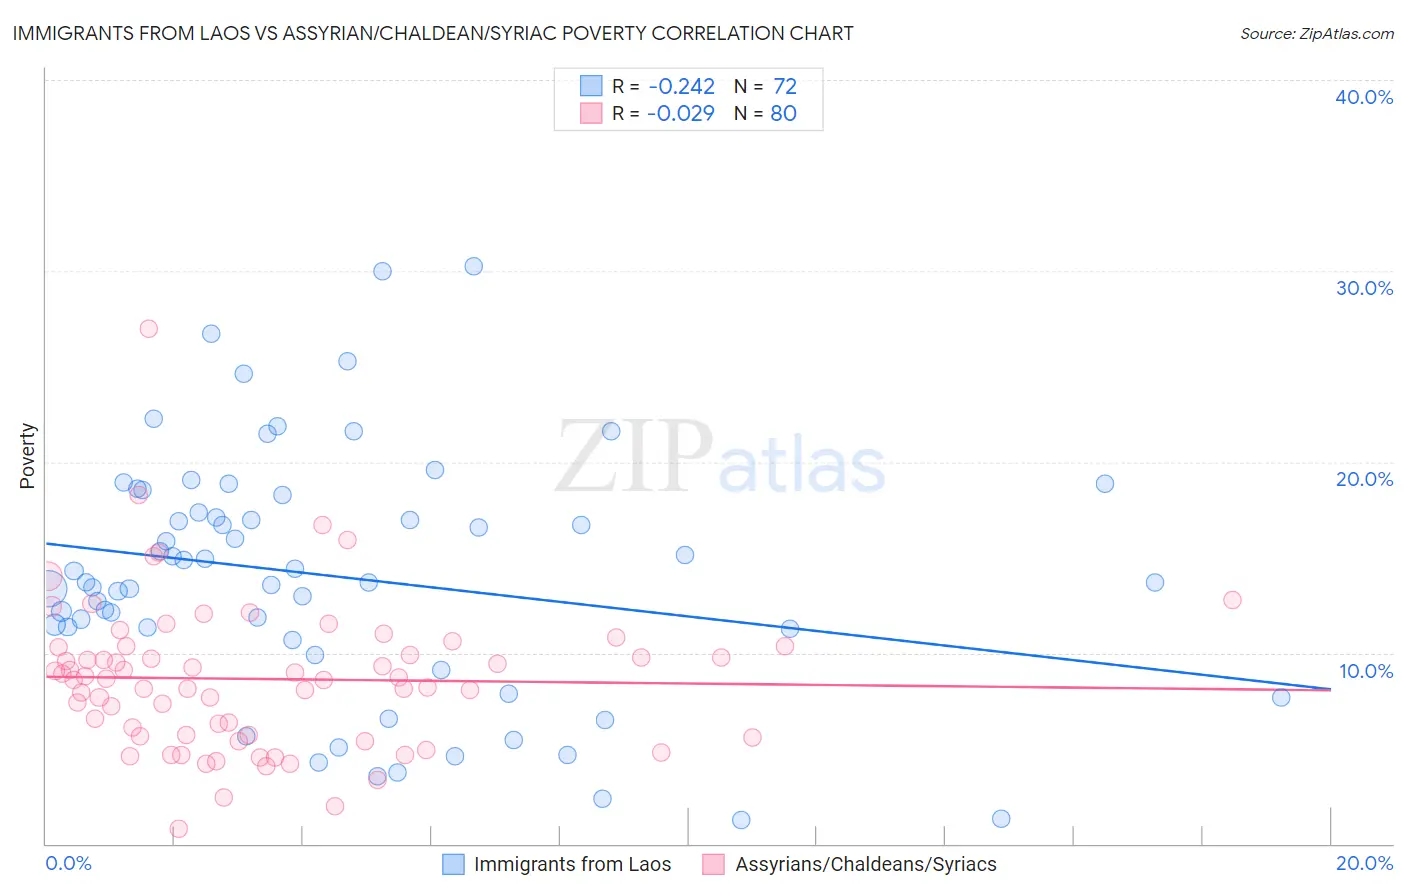
Immigrants from Laos vs Assyrian/Chaldean/Syriac Poverty Correlation Chart

The statistical analysis conducted on geographies consisting of 201,466,628 people shows a weak negative correlation between the proportion of Immigrants from Laos and poverty level in the United States with a correlation coefficient (R) of -0.242 and weighted average of 13.8%. Similarly, the statistical analysis conducted on geographies consisting of 110,294,236 people shows no correlation between the proportion of Assyrians/Chaldeans/Syriacs and poverty level in the United States with a correlation coefficient (R) of -0.029 and weighted average of 10.1%, a difference of 36.7%.
Immigrants from Laos vs Assyrian/Chaldean/Syriac Poverty

Poverty Correlation Summary

MeasurementImmigrants from LaosAssyrian/Chaldean/Syriac
Minimum1.2%0.75%
Maximum30.2%27.0%
Range29.0%26.2%
Mean14.0%8.6%
Median13.7%8.6%
Interquartile 25% (IQ1)11.0%5.7%
Interquartile 75% (IQ3)17.8%10.3%
Interquartile Range (IQR)6.8%4.6%
Standard Deviation (Sample)6.5%4.0%
Standard Deviation (Population)6.4%4.0%

Similar Demographics by Poverty

Demographics Similar to Immigrants from Laos by Poverty

In terms of poverty, the demographic groups most similar to Immigrants from Laos are Immigrants from Saudi Arabia (13.8%, a difference of 0.24%), Cuban (13.9%, a difference of 0.44%), Immigrants from Armenia (13.9%, a difference of 0.47%), Fijian (13.7%, a difference of 0.49%), and French American Indian (13.9%, a difference of 0.49%).
DemographicsRating | RankPoverty
Alaska Natives
2.1
/100
|
#227
Tragic
13.5%
Immigrants | Nigeria
1.7
/100
|
#228
Tragic
13.5%
Osage
1.5
/100
|
#229
Tragic
13.6%
Alaskan Athabascans
1.5
/100
|
#230
Tragic
13.6%
Nigerians
1.4
/100
|
#231
Tragic
13.6%
Fijians
0.8
/100
|
#232
Tragic
13.7%
Immigrants | Saudi Arabia
0.8
/100
|
#233
Tragic
13.8%
Immigrants | Laos
0.7
/100
|
#234
Tragic
13.8%
Cubans
0.6
/100
|
#235
Tragic
13.9%
Immigrants | Armenia
0.5
/100
|
#236
Tragic
13.9%
French American Indians
0.5
/100
|
#237
Tragic
13.9%
Ghanaians
0.5
/100
|
#238
Tragic
13.9%
Nicaraguans
0.4
/100
|
#239
Tragic
13.9%
Immigrants | Middle Africa
0.4
/100
|
#240
Tragic
14.0%
Salvadorans
0.4
/100
|
#241
Tragic
14.0%

Demographics Similar to Assyrians/Chaldeans/Syriacs by Poverty

In terms of poverty, the demographic groups most similar to Assyrians/Chaldeans/Syriacs are Filipino (10.1%, a difference of 0.14%), Immigrants from Ireland (10.1%, a difference of 0.18%), Maltese (10.2%, a difference of 0.56%), Immigrants from South Central Asia (10.2%, a difference of 1.0%), and Bulgarian (10.2%, a difference of 1.4%).
DemographicsRating | RankPoverty
Immigrants | India
100.0
/100
|
#1
Exceptional
9.0%
Chinese
100.0
/100
|
#2
Exceptional
9.5%
Thais
100.0
/100
|
#3
Exceptional
9.6%
Immigrants | Taiwan
100.0
/100
|
#4
Exceptional
9.7%
Immigrants | Ireland
99.9
/100
|
#5
Exceptional
10.1%
Assyrians/Chaldeans/Syriacs
99.9
/100
|
#6
Exceptional
10.1%
Filipinos
99.9
/100
|
#7
Exceptional
10.1%
Maltese
99.9
/100
|
#8
Exceptional
10.2%
Immigrants | South Central Asia
99.9
/100
|
#9
Exceptional
10.2%
Bulgarians
99.9
/100
|
#10
Exceptional
10.2%
Immigrants | Lithuania
99.9
/100
|
#11
Exceptional
10.3%
Bhutanese
99.8
/100
|
#12
Exceptional
10.4%
Immigrants | Hong Kong
99.8
/100
|
#13
Exceptional
10.4%
Immigrants | Bolivia
99.8
/100
|
#14
Exceptional
10.4%
Bolivians
99.8
/100
|
#15
Exceptional
10.4%