Immigrants from Kuwait vs Immigrants from Europe Female Poverty Among 25-34 Year Olds

COMPARE

Immigrants from Kuwait
Race
Ancestry
AfghanAfricanAlaska NativeAlaskan AthabascanAlbanianAleutAlsatianAmericanApacheArabArapahoArgentineanArmenianAssyrian/Chaldean/SyriacAustralianAustrianBahamianBangladeshiBarbadianBasqueBelgianBelizeanBermudanBhutaneseBlackfeetBolivianBrazilianBritishBritish West IndianBulgarianBurmeseCajunCambodianCanadianCape VerdeanCarpatho RusynCelticCentral AmericanCentral American IndianCherokeeCheyenneChickasawChileanChineseChippewaChoctawColombianColvilleComancheCosta RicanCreeCreekCroatianCrowCubanCypriotCzechCzechoslovakianDanishDelawareDominicanDutchDutch West IndianEastern EuropeanEcuadorianEgyptianEnglishEstonianEthiopianEuropeanFijianFilipinoFinnishFrenchFrench American IndianFrench CanadianGermanGerman RussianGhanaianGreekGuamanian/ChamorroGuatemalanGuyaneseHaitianHmongHonduranHopiHoumaHungarianIcelanderIndian (Asian)IndonesianInupiatIranianIraqiIrishIroquoisIsraeliItalianJamaicanJapaneseJordanianKenyanKiowaKoreanLaotianLatvianLebaneseLiberianLithuanianLumbeeLuxembourgerMacedonianMalaysianMalteseMarshalleseMenomineeMexicanMexican American IndianMongolianMoroccanNative HawaiianNavajoNepaleseNew ZealanderNicaraguanNigerianNorthern EuropeanNorwegianOkinawanOsageOttawaPaiutePakistaniPalestinianPanamanianParaguayanPennsylvania GermanPeruvianPimaPolishPortuguesePotawatomiPuebloPuerto RicanPuget Sound SalishRomanianRussianSalvadoranSamoanScandinavianScotch-IrishScottishSeminoleSenegaleseSerbianShoshoneSierra LeoneanSiouxSlavicSlovakSloveneSomaliSouth AfricanSouth AmericanSouth American IndianSoviet UnionSpaniardSpanishSpanish AmericanSpanish American IndianSri LankanSubsaharan AfricanSudaneseSwedishSwissSyrianTaiwaneseThaiTlingit-HaidaTohono O'OdhamTonganTrinidadian and TobagonianTsimshianTurkishU.S. Virgin IslanderUgandanUkrainianUruguayanUteVenezuelanVietnameseWelshWest IndianYakamaYaquiYugoslavianYumanYup'ikZimbabwean
Immigration
NonimmigrantsImmigrantsAfghanistanAfricaAlbaniaArgentinaArmeniaAsiaAustraliaAustriaBahamasBangladeshBarbadosBelarusBelgiumBelizeBoliviaBosnia and HerzegovinaBrazilBulgariaBurma/MyanmarCabo VerdeCambodiaCameroonCanadaCaribbeanCentral AmericaChileChinaColombiaCongoCosta RicaCroatiaCubaCzechoslovakiaDenmarkDominicaDominican RepublicEastern AfricaEastern AsiaEastern EuropeEcuadorEgyptEl SalvadorEnglandEritreaEthiopiaFijiFranceGermanyGhanaGreeceGrenadaGuatemalaGuyanaHaitiHondurasHong KongHungaryIndiaIndonesiaIranIraqIrelandIsraelItalyJamaicaJapanJordanKazakhstanKenyaKoreaKuwaitLaosLatin AmericaLatviaLebanonLiberiaLithuaniaMalaysiaMexicoMicronesiaMiddle AfricaMoldovaMoroccoNepalNetherlandsNicaraguaNigeriaNorth AmericaNorth MacedoniaNorthern AfricaNorthern EuropeNorwayOceaniaPakistanPanamaPeruPhilippinesPolandPortugalRomaniaRussiaSaudi ArabiaScotlandSenegalSerbiaSierra LeoneSingaporeSomaliaSouth AfricaSouth AmericaSouth Central AsiaSouth Eastern AsiaSouthern EuropeSpainSri LankaSt. Vincent and the GrenadinesSudanSwedenSwitzerlandSyriaTaiwanThailandTrinidad and TobagoTurkeyUgandaUkraineUruguayUzbekistanVenezuelaVietnamWest IndiesWestern AfricaWestern AsiaWestern EuropeYemenZaireZimbabweAzores
Immigrants from Europe
Race
Ancestry
AfghanAfricanAlaska NativeAlaskan AthabascanAlbanianAleutAlsatianAmericanApacheArabArapahoArgentineanArmenianAssyrian/Chaldean/SyriacAustralianAustrianBahamianBangladeshiBarbadianBasqueBelgianBelizeanBermudanBhutaneseBlackfeetBolivianBrazilianBritishBritish West IndianBulgarianBurmeseCajunCambodianCanadianCape VerdeanCarpatho RusynCelticCentral AmericanCentral American IndianCherokeeCheyenneChickasawChileanChineseChippewaChoctawColombianColvilleComancheCosta RicanCreeCreekCroatianCrowCubanCypriotCzechCzechoslovakianDanishDelawareDominicanDutchDutch West IndianEastern EuropeanEcuadorianEgyptianEnglishEstonianEthiopianEuropeanFijianFilipinoFinnishFrenchFrench American IndianFrench CanadianGermanGerman RussianGhanaianGreekGuamanian/ChamorroGuatemalanGuyaneseHaitianHmongHonduranHopiHoumaHungarianIcelanderIndian (Asian)IndonesianInupiatIranianIraqiIrishIroquoisIsraeliItalianJamaicanJapaneseJordanianKenyanKiowaKoreanLaotianLatvianLebaneseLiberianLithuanianLumbeeLuxembourgerMacedonianMalaysianMalteseMarshalleseMenomineeMexicanMexican American IndianMongolianMoroccanNative HawaiianNavajoNepaleseNew ZealanderNicaraguanNigerianNorthern EuropeanNorwegianOkinawanOsageOttawaPaiutePakistaniPalestinianPanamanianParaguayanPennsylvania GermanPeruvianPimaPolishPortuguesePotawatomiPuebloPuerto RicanPuget Sound SalishRomanianRussianSalvadoranSamoanScandinavianScotch-IrishScottishSeminoleSenegaleseSerbianShoshoneSierra LeoneanSiouxSlavicSlovakSloveneSomaliSouth AfricanSouth AmericanSouth American IndianSoviet UnionSpaniardSpanishSpanish AmericanSpanish American IndianSri LankanSubsaharan AfricanSudaneseSwedishSwissSyrianTaiwaneseThaiTlingit-HaidaTohono O'OdhamTonganTrinidadian and TobagonianTsimshianTurkishU.S. Virgin IslanderUgandanUkrainianUruguayanUteVenezuelanVietnameseWelshWest IndianYakamaYaquiYugoslavianYumanYup'ikZimbabwean
Immigration
NonimmigrantsImmigrantsAfghanistanAfricaAlbaniaArgentinaArmeniaAsiaAustraliaAustriaBahamasBangladeshBarbadosBelarusBelgiumBelizeBoliviaBosnia and HerzegovinaBrazilBulgariaBurma/MyanmarCabo VerdeCambodiaCameroonCanadaCaribbeanCentral AmericaChileChinaColombiaCongoCosta RicaCroatiaCubaCzechoslovakiaDenmarkDominicaDominican RepublicEastern AfricaEastern AsiaEastern EuropeEcuadorEgyptEl SalvadorEnglandEritreaEthiopiaEuropeFijiFranceGermanyGhanaGreeceGrenadaGuatemalaGuyanaHaitiHondurasHong KongHungaryIndiaIndonesiaIranIraqIrelandIsraelItalyJamaicaJapanJordanKazakhstanKenyaKoreaLaosLatin AmericaLatviaLebanonLiberiaLithuaniaMalaysiaMexicoMicronesiaMiddle AfricaMoldovaMoroccoNepalNetherlandsNicaraguaNigeriaNorth AmericaNorth MacedoniaNorthern AfricaNorthern EuropeNorwayOceaniaPakistanPanamaPeruPhilippinesPolandPortugalRomaniaRussiaSaudi ArabiaScotlandSenegalSerbiaSierra LeoneSingaporeSomaliaSouth AfricaSouth AmericaSouth Central AsiaSouth Eastern AsiaSouthern EuropeSpainSri LankaSt. Vincent and the GrenadinesSudanSwedenSwitzerlandSyriaTaiwanThailandTrinidad and TobagoTurkeyUgandaUkraineUruguayUzbekistanVenezuelaVietnamWest IndiesWestern AfricaWestern AsiaWestern EuropeYemenZaireZimbabweAzores
Female Poverty Among 25-34 Year Olds
Income
Poverty
Unemployment
Labor Participation
Family Structure
Vehicle Availability
Education Level
Disability

Female Poverty Among 25-34 Year Olds Comparison

Immigrants from Kuwait

Immigrants from Europe

Exceptional
Exceptional
12.8%
FEMALE POVERTY AMONG 25-34 YEAR OLDS
93.1/ 100
METRIC RATING
117th/ 347
METRIC RANK
12.2%
FEMALE POVERTY AMONG 25-34 YEAR OLDS
99.2/ 100
METRIC RATING
66th/ 347
METRIC RANK

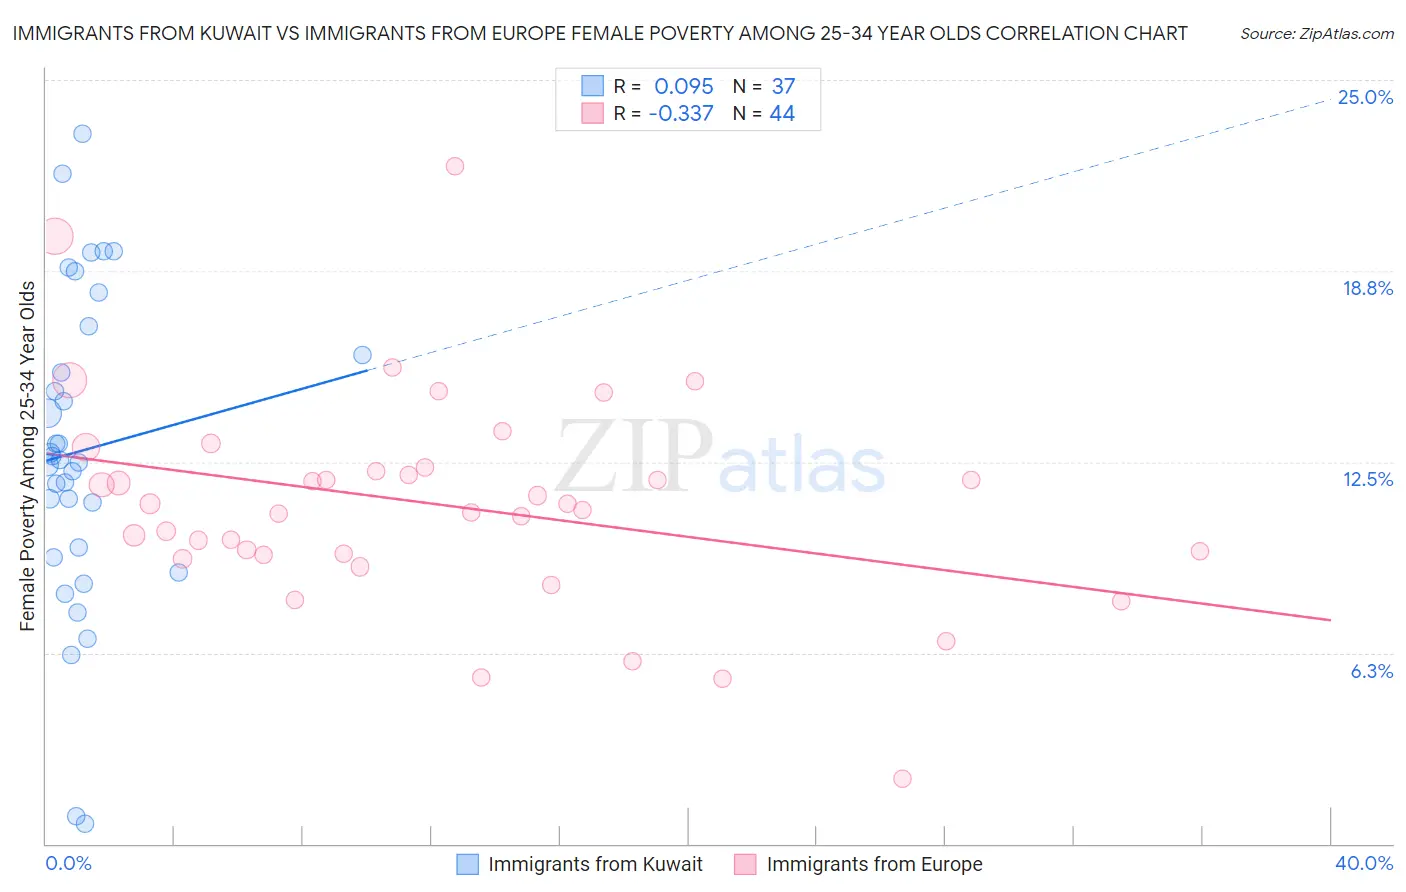
Immigrants from Kuwait vs Immigrants from Europe Female Poverty Among 25-34 Year Olds Correlation Chart

The statistical analysis conducted on geographies consisting of 136,324,073 people shows a slight positive correlation between the proportion of Immigrants from Kuwait and poverty level among females between the ages 25 and 34 in the United States with a correlation coefficient (R) of 0.095 and weighted average of 12.8%. Similarly, the statistical analysis conducted on geographies consisting of 529,126,635 people shows a mild negative correlation between the proportion of Immigrants from Europe and poverty level among females between the ages 25 and 34 in the United States with a correlation coefficient (R) of -0.337 and weighted average of 12.2%, a difference of 5.2%.
Immigrants from Kuwait vs Immigrants from Europe Female Poverty Among 25-34 Year Olds

Female Poverty Among 25-34 Year Olds Correlation Summary

MeasurementImmigrants from KuwaitImmigrants from Europe
Minimum0.66%2.1%
Maximum23.2%22.2%
Range22.6%20.0%
Mean12.9%11.1%
Median12.6%11.0%
Interquartile 25% (IQ1)9.5%9.5%
Interquartile 75% (IQ3)16.5%12.3%
Interquartile Range (IQR)6.9%2.8%
Standard Deviation (Sample)5.1%3.5%
Standard Deviation (Population)5.1%3.5%

Similar Demographics by Female Poverty Among 25-34 Year Olds

Demographics Similar to Immigrants from Kuwait by Female Poverty Among 25-34 Year Olds

In terms of female poverty among 25-34 year olds, the demographic groups most similar to Immigrants from Kuwait are Mongolian (12.8%, a difference of 0.010%), Immigrants from Nepal (12.8%, a difference of 0.020%), Carpatho Rusyn (12.8%, a difference of 0.030%), Chilean (12.8%, a difference of 0.060%), and Immigrants from Brazil (12.8%, a difference of 0.090%).
DemographicsRating | RankFemale Poverty Among 25-34 Year Olds
Australians
94.1
/100
|
#110
Exceptional
12.8%
Danes
93.9
/100
|
#111
Exceptional
12.8%
Immigrants | Morocco
93.9
/100
|
#112
Exceptional
12.8%
Immigrants | Syria
93.8
/100
|
#113
Exceptional
12.8%
Immigrants | Southern Europe
93.6
/100
|
#114
Exceptional
12.8%
Immigrants | Brazil
93.3
/100
|
#115
Exceptional
12.8%
Chileans
93.2
/100
|
#116
Exceptional
12.8%
Immigrants | Kuwait
93.1
/100
|
#117
Exceptional
12.8%
Mongolians
93.0
/100
|
#118
Exceptional
12.8%
Immigrants | Nepal
93.0
/100
|
#119
Exceptional
12.8%
Carpatho Rusyns
93.0
/100
|
#120
Exceptional
12.8%
Romanians
92.8
/100
|
#121
Exceptional
12.8%
Immigrants | Western Asia
92.7
/100
|
#122
Exceptional
12.8%
Slovenes
92.7
/100
|
#123
Exceptional
12.8%
Immigrants | Netherlands
92.0
/100
|
#124
Exceptional
12.8%

Demographics Similar to Immigrants from Europe by Female Poverty Among 25-34 Year Olds

In terms of female poverty among 25-34 year olds, the demographic groups most similar to Immigrants from Europe are Armenian (12.2%, a difference of 0.060%), Immigrants from Russia (12.2%, a difference of 0.070%), Laotian (12.2%, a difference of 0.12%), Soviet Union (12.1%, a difference of 0.31%), and Immigrants from Moldova (12.1%, a difference of 0.32%).
DemographicsRating | RankFemale Poverty Among 25-34 Year Olds
Russians
99.4
/100
|
#59
Exceptional
12.1%
Immigrants | Northern Europe
99.4
/100
|
#60
Exceptional
12.1%
Immigrants | Czechoslovakia
99.4
/100
|
#61
Exceptional
12.1%
Immigrants | Moldova
99.3
/100
|
#62
Exceptional
12.1%
Soviet Union
99.3
/100
|
#63
Exceptional
12.1%
Immigrants | Russia
99.2
/100
|
#64
Exceptional
12.2%
Armenians
99.2
/100
|
#65
Exceptional
12.2%
Immigrants | Europe
99.2
/100
|
#66
Exceptional
12.2%
Laotians
99.2
/100
|
#67
Exceptional
12.2%
Sri Lankans
99.1
/100
|
#68
Exceptional
12.2%
Immigrants | Lebanon
99.1
/100
|
#69
Exceptional
12.2%
Immigrants | Belgium
99.1
/100
|
#70
Exceptional
12.2%
Immigrants | Scotland
99.1
/100
|
#71
Exceptional
12.2%
Lithuanians
99.1
/100
|
#72
Exceptional
12.2%
Immigrants | Vietnam
98.9
/100
|
#73
Exceptional
12.3%