Immigrants from Korea vs French Female Poverty Among 25-34 Year Olds

COMPARE

Immigrants from Korea
Race
Ancestry
AfghanAfricanAlaska NativeAlaskan AthabascanAlbanianAleutAlsatianAmericanApacheArabArapahoArgentineanArmenianAssyrian/Chaldean/SyriacAustralianAustrianBahamianBangladeshiBarbadianBasqueBelgianBelizeanBermudanBhutaneseBlackfeetBolivianBrazilianBritishBritish West IndianBulgarianBurmeseCajunCambodianCanadianCape VerdeanCarpatho RusynCelticCentral AmericanCentral American IndianCherokeeCheyenneChickasawChileanChineseChippewaChoctawColombianColvilleComancheCosta RicanCreeCreekCroatianCrowCubanCypriotCzechCzechoslovakianDanishDelawareDominicanDutchDutch West IndianEastern EuropeanEcuadorianEgyptianEnglishEstonianEthiopianEuropeanFijianFilipinoFinnishFrench American IndianFrench CanadianGermanGerman RussianGhanaianGreekGuamanian/ChamorroGuatemalanGuyaneseHaitianHmongHonduranHopiHoumaHungarianIcelanderIndian (Asian)IndonesianInupiatIranianIraqiIrishIroquoisIsraeliItalianJamaicanJapaneseJordanianKenyanKiowaKoreanLaotianLatvianLebaneseLiberianLithuanianLumbeeLuxembourgerMacedonianMalaysianMalteseMarshalleseMenomineeMexicanMexican American IndianMongolianMoroccanNative HawaiianNavajoNepaleseNew ZealanderNicaraguanNigerianNorthern EuropeanNorwegianOkinawanOsageOttawaPaiutePakistaniPalestinianPanamanianParaguayanPennsylvania GermanPeruvianPimaPolishPortuguesePotawatomiPuebloPuerto RicanPuget Sound SalishRomanianRussianSalvadoranSamoanScandinavianScotch-IrishScottishSeminoleSenegaleseSerbianShoshoneSierra LeoneanSiouxSlavicSlovakSloveneSomaliSouth AfricanSouth AmericanSouth American IndianSoviet UnionSpaniardSpanishSpanish AmericanSpanish American IndianSri LankanSubsaharan AfricanSudaneseSwedishSwissSyrianTaiwaneseThaiTlingit-HaidaTohono O'OdhamTonganTrinidadian and TobagonianTsimshianTurkishU.S. Virgin IslanderUgandanUkrainianUruguayanUteVenezuelanVietnameseWelshWest IndianYakamaYaquiYugoslavianYumanYup'ikZimbabwean
Immigration
NonimmigrantsImmigrantsAfghanistanAfricaAlbaniaArgentinaArmeniaAsiaAustraliaAustriaBahamasBangladeshBarbadosBelarusBelgiumBelizeBoliviaBosnia and HerzegovinaBrazilBulgariaBurma/MyanmarCabo VerdeCambodiaCameroonCanadaCaribbeanCentral AmericaChileChinaColombiaCongoCosta RicaCroatiaCubaCzechoslovakiaDenmarkDominicaDominican RepublicEastern AfricaEastern AsiaEastern EuropeEcuadorEgyptEl SalvadorEnglandEritreaEthiopiaEuropeFijiFranceGermanyGhanaGreeceGrenadaGuatemalaGuyanaHaitiHondurasHong KongHungaryIndiaIndonesiaIranIraqIrelandIsraelItalyJamaicaJapanJordanKazakhstanKenyaKoreaKuwaitLaosLatin AmericaLatviaLebanonLiberiaLithuaniaMalaysiaMexicoMicronesiaMiddle AfricaMoldovaMoroccoNepalNetherlandsNicaraguaNigeriaNorth AmericaNorth MacedoniaNorthern AfricaNorthern EuropeNorwayOceaniaPakistanPanamaPeruPhilippinesPolandPortugalRomaniaRussiaSaudi ArabiaScotlandSenegalSerbiaSierra LeoneSingaporeSomaliaSouth AfricaSouth AmericaSouth Central AsiaSouth Eastern AsiaSouthern EuropeSpainSri LankaSt. Vincent and the GrenadinesSudanSwedenSwitzerlandSyriaTaiwanThailandTrinidad and TobagoTurkeyUgandaUkraineUruguayUzbekistanVenezuelaVietnamWest IndiesWestern AfricaWestern AsiaWestern EuropeYemenZaireZimbabweAzores
French
Race
Ancestry
AfghanAfricanAlaska NativeAlaskan AthabascanAlbanianAleutAlsatianAmericanApacheArabArapahoArgentineanArmenianAssyrian/Chaldean/SyriacAustralianAustrianBahamianBangladeshiBarbadianBasqueBelgianBelizeanBermudanBhutaneseBlackfeetBolivianBrazilianBritishBritish West IndianBulgarianBurmeseCajunCambodianCanadianCape VerdeanCarpatho RusynCelticCentral AmericanCentral American IndianCherokeeCheyenneChickasawChileanChineseChippewaChoctawColombianColvilleComancheCosta RicanCreeCreekCroatianCrowCubanCypriotCzechCzechoslovakianDanishDelawareDominicanDutchDutch West IndianEastern EuropeanEcuadorianEgyptianEnglishEstonianEthiopianEuropeanFijianFilipinoFinnishFrenchFrench American IndianFrench CanadianGermanGerman RussianGhanaianGreekGuamanian/ChamorroGuatemalanGuyaneseHaitianHmongHonduranHopiHoumaHungarianIcelanderIndian (Asian)IndonesianInupiatIranianIraqiIrishIroquoisIsraeliItalianJamaicanJapaneseJordanianKenyanKiowaKoreanLaotianLatvianLebaneseLiberianLithuanianLumbeeLuxembourgerMacedonianMalaysianMalteseMarshalleseMenomineeMexicanMexican American IndianMongolianMoroccanNative HawaiianNavajoNepaleseNew ZealanderNicaraguanNigerianNorthern EuropeanNorwegianOkinawanOsageOttawaPaiutePakistaniPalestinianPanamanianParaguayanPennsylvania GermanPeruvianPimaPolishPortuguesePotawatomiPuebloPuerto RicanPuget Sound SalishRomanianRussianSalvadoranSamoanScandinavianScotch-IrishScottishSeminoleSenegaleseSerbianShoshoneSierra LeoneanSiouxSlavicSlovakSloveneSomaliSouth AfricanSouth AmericanSouth American IndianSoviet UnionSpaniardSpanishSpanish AmericanSpanish American IndianSri LankanSubsaharan AfricanSudaneseSwedishSwissSyrianTaiwaneseThaiTlingit-HaidaTohono O'OdhamTonganTrinidadian and TobagonianTsimshianTurkishU.S. Virgin IslanderUgandanUkrainianUruguayanUteVenezuelanVietnameseWelshWest IndianYakamaYaquiYugoslavianYumanYup'ikZimbabwean
Immigration
NonimmigrantsImmigrantsAfghanistanAfricaAlbaniaArgentinaArmeniaAsiaAustraliaAustriaBahamasBangladeshBarbadosBelarusBelgiumBelizeBoliviaBosnia and HerzegovinaBrazilBulgariaBurma/MyanmarCabo VerdeCambodiaCameroonCanadaCaribbeanCentral AmericaChileChinaColombiaCongoCosta RicaCroatiaCubaCzechoslovakiaDenmarkDominicaDominican RepublicEastern AfricaEastern AsiaEastern EuropeEcuadorEgyptEl SalvadorEnglandEritreaEthiopiaEuropeFijiFranceGermanyGhanaGreeceGrenadaGuatemalaGuyanaHaitiHondurasHong KongHungaryIndiaIndonesiaIranIraqIrelandIsraelItalyJamaicaJapanJordanKazakhstanKenyaKuwaitLaosLatin AmericaLatviaLebanonLiberiaLithuaniaMalaysiaMexicoMicronesiaMiddle AfricaMoldovaMoroccoNepalNetherlandsNicaraguaNigeriaNorth AmericaNorth MacedoniaNorthern AfricaNorthern EuropeNorwayOceaniaPakistanPanamaPeruPhilippinesPolandPortugalRomaniaRussiaSaudi ArabiaScotlandSenegalSerbiaSierra LeoneSingaporeSomaliaSouth AfricaSouth AmericaSouth Central AsiaSouth Eastern AsiaSouthern EuropeSpainSri LankaSt. Vincent and the GrenadinesSudanSwedenSwitzerlandSyriaTaiwanThailandTrinidad and TobagoTurkeyUgandaUkraineUruguayUzbekistanVenezuelaVietnamWest IndiesWestern AfricaWestern AsiaWestern EuropeYemenZaireZimbabweAzores
Female Poverty Among 25-34 Year Olds
Income
Poverty
Unemployment
Labor Participation
Family Structure
Vehicle Availability
Education Level
Disability

Female Poverty Among 25-34 Year Olds Comparison

Immigrants from Korea

French

Exceptional
Tragic
11.1%
FEMALE POVERTY AMONG 25-34 YEAR OLDS
100.0/ 100
METRIC RATING
11th/ 347
METRIC RANK
14.3%
FEMALE POVERTY AMONG 25-34 YEAR OLDS
6.2/ 100
METRIC RATING
214th/ 347
METRIC RANK

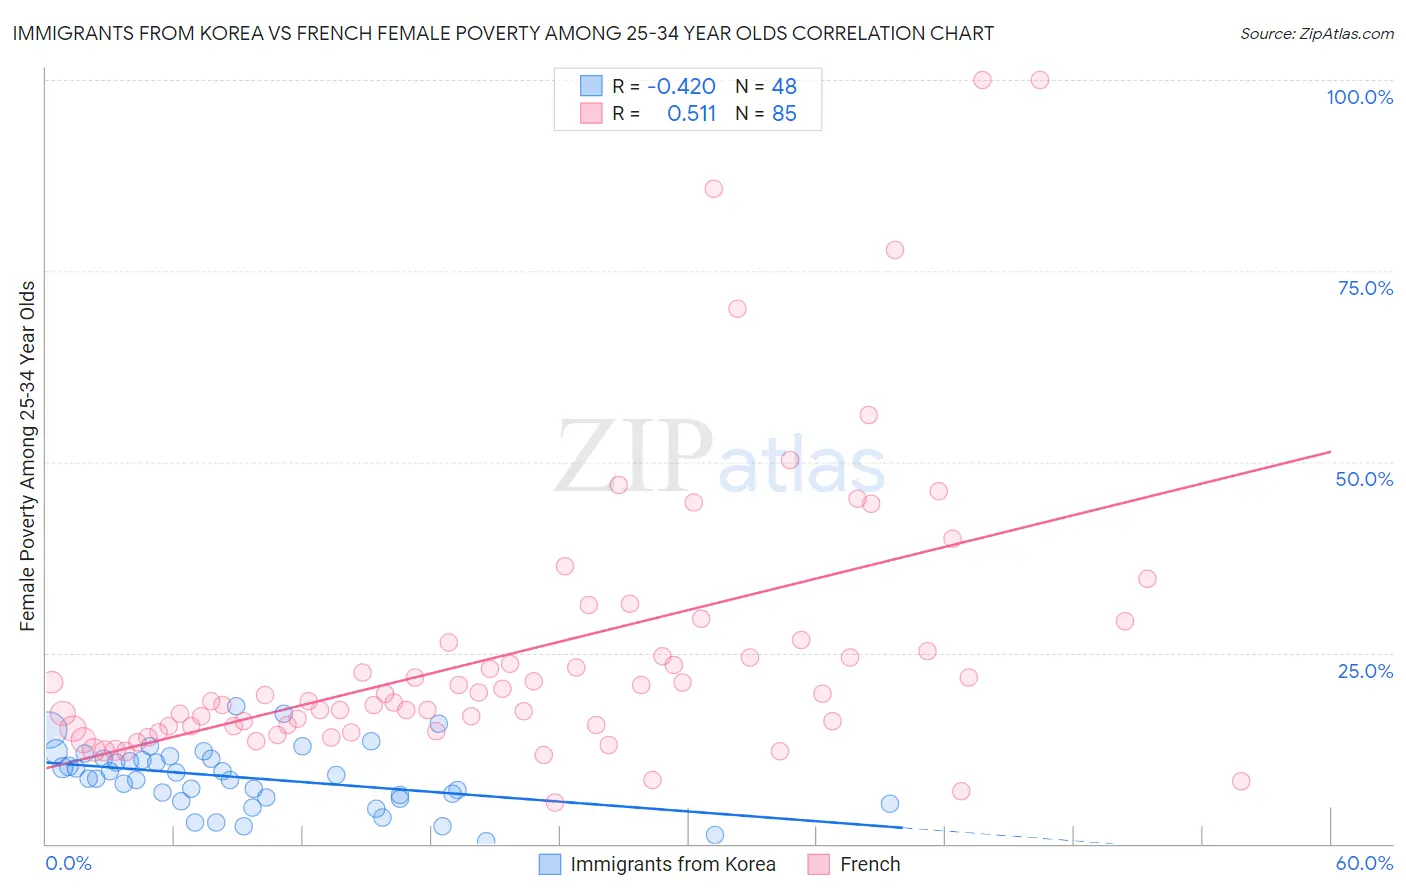
Immigrants from Korea vs French Female Poverty Among 25-34 Year Olds Correlation Chart

The statistical analysis conducted on geographies consisting of 408,247,185 people shows a moderate negative correlation between the proportion of Immigrants from Korea and poverty level among females between the ages 25 and 34 in the United States with a correlation coefficient (R) of -0.420 and weighted average of 11.1%. Similarly, the statistical analysis conducted on geographies consisting of 549,843,638 people shows a substantial positive correlation between the proportion of French and poverty level among females between the ages 25 and 34 in the United States with a correlation coefficient (R) of 0.511 and weighted average of 14.3%, a difference of 28.2%.
Immigrants from Korea vs French Female Poverty Among 25-34 Year Olds

Female Poverty Among 25-34 Year Olds Correlation Summary

MeasurementImmigrants from KoreaFrench
Minimum0.35%5.5%
Maximum18.1%100.0%
Range17.7%94.5%
Mean8.6%25.2%
Median8.8%18.7%
Interquartile 25% (IQ1)5.9%15.2%
Interquartile 75% (IQ3)11.1%25.8%
Interquartile Range (IQR)5.2%10.6%
Standard Deviation (Sample)4.1%18.7%
Standard Deviation (Population)4.0%18.6%

Similar Demographics by Female Poverty Among 25-34 Year Olds

Demographics Similar to Immigrants from Korea by Female Poverty Among 25-34 Year Olds

In terms of female poverty among 25-34 year olds, the demographic groups most similar to Immigrants from Korea are Immigrants from Ireland (11.2%, a difference of 0.13%), Burmese (11.2%, a difference of 0.24%), Indian (Asian) (11.2%, a difference of 0.24%), Assyrian/Chaldean/Syriac (11.2%, a difference of 0.35%), and Immigrants from Bolivia (11.2%, a difference of 0.39%).
DemographicsRating | RankFemale Poverty Among 25-34 Year Olds
Thais
100.0
/100
|
#4
Exceptional
10.2%
Immigrants | Hong Kong
100.0
/100
|
#5
Exceptional
10.4%
Immigrants | South Central Asia
100.0
/100
|
#6
Exceptional
10.8%
Chinese
100.0
/100
|
#7
Exceptional
11.0%
Immigrants | Iran
100.0
/100
|
#8
Exceptional
11.0%
Immigrants | Singapore
100.0
/100
|
#9
Exceptional
11.1%
Immigrants | Lithuania
100.0
/100
|
#10
Exceptional
11.1%
Immigrants | Korea
100.0
/100
|
#11
Exceptional
11.1%
Immigrants | Ireland
100.0
/100
|
#12
Exceptional
11.2%
Burmese
100.0
/100
|
#13
Exceptional
11.2%
Indians (Asian)
100.0
/100
|
#14
Exceptional
11.2%
Assyrians/Chaldeans/Syriacs
100.0
/100
|
#15
Exceptional
11.2%
Immigrants | Bolivia
100.0
/100
|
#16
Exceptional
11.2%
Immigrants | China
100.0
/100
|
#17
Exceptional
11.2%
Immigrants | Eastern Asia
100.0
/100
|
#18
Exceptional
11.2%

Demographics Similar to French by Female Poverty Among 25-34 Year Olds

In terms of female poverty among 25-34 year olds, the demographic groups most similar to French are Immigrants from Nigeria (14.3%, a difference of 0.020%), Puget Sound Salish (14.3%, a difference of 0.10%), Immigrants from Guyana (14.3%, a difference of 0.13%), French Canadian (14.3%, a difference of 0.27%), and Spanish American Indian (14.3%, a difference of 0.27%).
DemographicsRating | RankFemale Poverty Among 25-34 Year Olds
Japanese
11.7
/100
|
#207
Poor
14.1%
Immigrants | Panama
11.6
/100
|
#208
Poor
14.1%
Guyanese
8.6
/100
|
#209
Tragic
14.2%
Panamanians
8.6
/100
|
#210
Tragic
14.2%
Trinidadians and Tobagonians
8.2
/100
|
#211
Tragic
14.2%
Immigrants | Guyana
6.6
/100
|
#212
Tragic
14.3%
Puget Sound Salish
6.5
/100
|
#213
Tragic
14.3%
French
6.2
/100
|
#214
Tragic
14.3%
Immigrants | Nigeria
6.2
/100
|
#215
Tragic
14.3%
French Canadians
5.5
/100
|
#216
Tragic
14.3%
Spanish American Indians
5.5
/100
|
#217
Tragic
14.3%
Immigrants | Thailand
5.2
/100
|
#218
Tragic
14.3%
Ecuadorians
5.2
/100
|
#219
Tragic
14.3%
Ghanaians
4.8
/100
|
#220
Tragic
14.4%
Sudanese
4.4
/100
|
#221
Tragic
14.4%