Immigrants from Kenya vs Immigrants from Zaire Child Poverty Among Boys Under 16

COMPARE

Immigrants from Kenya
Race
Ancestry
AfghanAfricanAlaska NativeAlaskan AthabascanAlbanianAleutAlsatianAmericanApacheArabArapahoArgentineanArmenianAssyrian/Chaldean/SyriacAustralianAustrianBahamianBangladeshiBarbadianBasqueBelgianBelizeanBermudanBhutaneseBlackfeetBolivianBrazilianBritishBritish West IndianBulgarianBurmeseCajunCambodianCanadianCape VerdeanCarpatho RusynCelticCentral AmericanCentral American IndianCherokeeCheyenneChickasawChileanChineseChippewaChoctawColombianColvilleComancheCosta RicanCreeCreekCroatianCrowCubanCypriotCzechCzechoslovakianDanishDelawareDominicanDutchDutch West IndianEastern EuropeanEcuadorianEgyptianEnglishEstonianEthiopianEuropeanFijianFilipinoFinnishFrenchFrench American IndianFrench CanadianGermanGerman RussianGhanaianGreekGuamanian/ChamorroGuatemalanGuyaneseHaitianHmongHonduranHopiHoumaHungarianIcelanderIndian (Asian)IndonesianInupiatIranianIraqiIrishIroquoisIsraeliItalianJamaicanJapaneseJordanianKenyanKiowaKoreanLaotianLatvianLebaneseLiberianLithuanianLumbeeLuxembourgerMacedonianMalaysianMalteseMarshalleseMenomineeMexicanMexican American IndianMongolianMoroccanNative HawaiianNavajoNepaleseNew ZealanderNicaraguanNigerianNorthern EuropeanNorwegianOkinawanOsageOttawaPaiutePakistaniPalestinianPanamanianParaguayanPennsylvania GermanPeruvianPimaPolishPortuguesePotawatomiPuebloPuerto RicanPuget Sound SalishRomanianRussianSalvadoranSamoanScandinavianScotch-IrishScottishSeminoleSenegaleseSerbianShoshoneSierra LeoneanSiouxSlavicSlovakSloveneSomaliSouth AfricanSouth AmericanSouth American IndianSoviet UnionSpaniardSpanishSpanish AmericanSpanish American IndianSri LankanSubsaharan AfricanSudaneseSwedishSwissSyrianTaiwaneseThaiTlingit-HaidaTohono O'OdhamTonganTrinidadian and TobagonianTsimshianTurkishU.S. Virgin IslanderUgandanUkrainianUruguayanUteVenezuelanVietnameseWelshWest IndianYakamaYaquiYugoslavianYumanYup'ikZimbabwean
Immigration
NonimmigrantsImmigrantsAfghanistanAfricaAlbaniaArgentinaArmeniaAsiaAustraliaAustriaBahamasBangladeshBarbadosBelarusBelgiumBelizeBoliviaBosnia and HerzegovinaBrazilBulgariaBurma/MyanmarCabo VerdeCambodiaCameroonCanadaCaribbeanCentral AmericaChileChinaColombiaCongoCosta RicaCroatiaCubaCzechoslovakiaDenmarkDominicaDominican RepublicEastern AfricaEastern AsiaEastern EuropeEcuadorEgyptEl SalvadorEnglandEritreaEthiopiaEuropeFijiFranceGermanyGhanaGreeceGrenadaGuatemalaGuyanaHaitiHondurasHong KongHungaryIndiaIndonesiaIranIraqIrelandIsraelItalyJamaicaJapanJordanKazakhstanKenyaKoreaKuwaitLaosLatin AmericaLatviaLebanonLiberiaLithuaniaMalaysiaMexicoMicronesiaMiddle AfricaMoldovaMoroccoNepalNetherlandsNicaraguaNigeriaNorth AmericaNorth MacedoniaNorthern AfricaNorthern EuropeNorwayOceaniaPakistanPanamaPeruPhilippinesPolandPortugalRomaniaRussiaSaudi ArabiaScotlandSenegalSerbiaSierra LeoneSingaporeSomaliaSouth AfricaSouth AmericaSouth Central AsiaSouth Eastern AsiaSouthern EuropeSpainSri LankaSt. Vincent and the GrenadinesSudanSwedenSwitzerlandSyriaTaiwanThailandTrinidad and TobagoTurkeyUgandaUkraineUruguayUzbekistanVenezuelaVietnamWest IndiesWestern AfricaWestern AsiaWestern EuropeYemenZimbabweAzores
Immigrants from Zaire
Race
Ancestry
AfghanAfricanAlaska NativeAlaskan AthabascanAlbanianAleutAlsatianAmericanApacheArabArapahoArgentineanArmenianAssyrian/Chaldean/SyriacAustralianAustrianBahamianBangladeshiBarbadianBasqueBelgianBelizeanBermudanBhutaneseBlackfeetBolivianBrazilianBritishBritish West IndianBulgarianBurmeseCajunCambodianCanadianCape VerdeanCarpatho RusynCelticCentral AmericanCentral American IndianCherokeeCheyenneChickasawChileanChineseChippewaChoctawColombianColvilleComancheCosta RicanCreeCreekCroatianCrowCubanCypriotCzechCzechoslovakianDanishDelawareDominicanDutchDutch West IndianEastern EuropeanEcuadorianEgyptianEnglishEstonianEthiopianEuropeanFijianFilipinoFinnishFrenchFrench American IndianFrench CanadianGermanGerman RussianGhanaianGreekGuamanian/ChamorroGuatemalanGuyaneseHaitianHmongHonduranHopiHoumaHungarianIcelanderIndian (Asian)IndonesianInupiatIranianIraqiIrishIroquoisIsraeliItalianJamaicanJapaneseJordanianKenyanKiowaKoreanLaotianLatvianLebaneseLiberianLithuanianLumbeeLuxembourgerMacedonianMalaysianMalteseMarshalleseMenomineeMexicanMexican American IndianMongolianMoroccanNative HawaiianNavajoNepaleseNew ZealanderNicaraguanNigerianNorthern EuropeanNorwegianOkinawanOsageOttawaPaiutePakistaniPalestinianPanamanianParaguayanPennsylvania GermanPeruvianPimaPolishPortuguesePotawatomiPuebloPuerto RicanPuget Sound SalishRomanianRussianSalvadoranSamoanScandinavianScotch-IrishScottishSeminoleSenegaleseSerbianShoshoneSierra LeoneanSiouxSlavicSlovakSloveneSomaliSouth AfricanSouth AmericanSouth American IndianSoviet UnionSpaniardSpanishSpanish AmericanSpanish American IndianSri LankanSubsaharan AfricanSudaneseSwedishSwissSyrianTaiwaneseThaiTlingit-HaidaTohono O'OdhamTonganTrinidadian and TobagonianTsimshianTurkishU.S. Virgin IslanderUgandanUkrainianUruguayanUteVenezuelanVietnameseWelshWest IndianYakamaYaquiYugoslavianYumanYup'ikZimbabwean
Immigration
NonimmigrantsImmigrantsAfghanistanAfricaAlbaniaArgentinaArmeniaAsiaAustraliaAustriaBahamasBangladeshBarbadosBelarusBelgiumBelizeBoliviaBosnia and HerzegovinaBrazilBulgariaBurma/MyanmarCabo VerdeCambodiaCameroonCanadaCaribbeanCentral AmericaChileChinaColombiaCongoCosta RicaCroatiaCubaCzechoslovakiaDenmarkDominicaDominican RepublicEastern AfricaEastern AsiaEastern EuropeEcuadorEgyptEl SalvadorEnglandEritreaEthiopiaEuropeFijiFranceGermanyGhanaGreeceGrenadaGuatemalaGuyanaHaitiHondurasHong KongHungaryIndiaIndonesiaIranIraqIrelandIsraelItalyJamaicaJapanJordanKazakhstanKoreaKuwaitLaosLatin AmericaLatviaLebanonLiberiaLithuaniaMalaysiaMexicoMicronesiaMiddle AfricaMoldovaMoroccoNepalNetherlandsNicaraguaNigeriaNorth AmericaNorth MacedoniaNorthern AfricaNorthern EuropeNorwayOceaniaPakistanPanamaPeruPhilippinesPolandPortugalRomaniaRussiaSaudi ArabiaScotlandSenegalSerbiaSierra LeoneSingaporeSomaliaSouth AfricaSouth AmericaSouth Central AsiaSouth Eastern AsiaSouthern EuropeSpainSri LankaSt. Vincent and the GrenadinesSudanSwedenSwitzerlandSyriaTaiwanThailandTrinidad and TobagoTurkeyUgandaUkraineUruguayUzbekistanVenezuelaVietnamWest IndiesWestern AfricaWestern AsiaWestern EuropeYemenZaireZimbabweAzores
Child Poverty Among Boys Under 16
Income
Poverty
Unemployment
Labor Participation
Family Structure
Vehicle Availability
Education Level
Disability

Child Poverty Among Boys Under 16 Comparison

Immigrants from Kenya

Immigrants from Zaire

Fair
Tragic
17.1%
CHILD POVERTY AMONG BOYS UNDER 16
20.1/ 100
METRIC RATING
197th/ 347
METRIC RANK
20.1%
CHILD POVERTY AMONG BOYS UNDER 16
0.0/ 100
METRIC RATING
281st/ 347
METRIC RANK

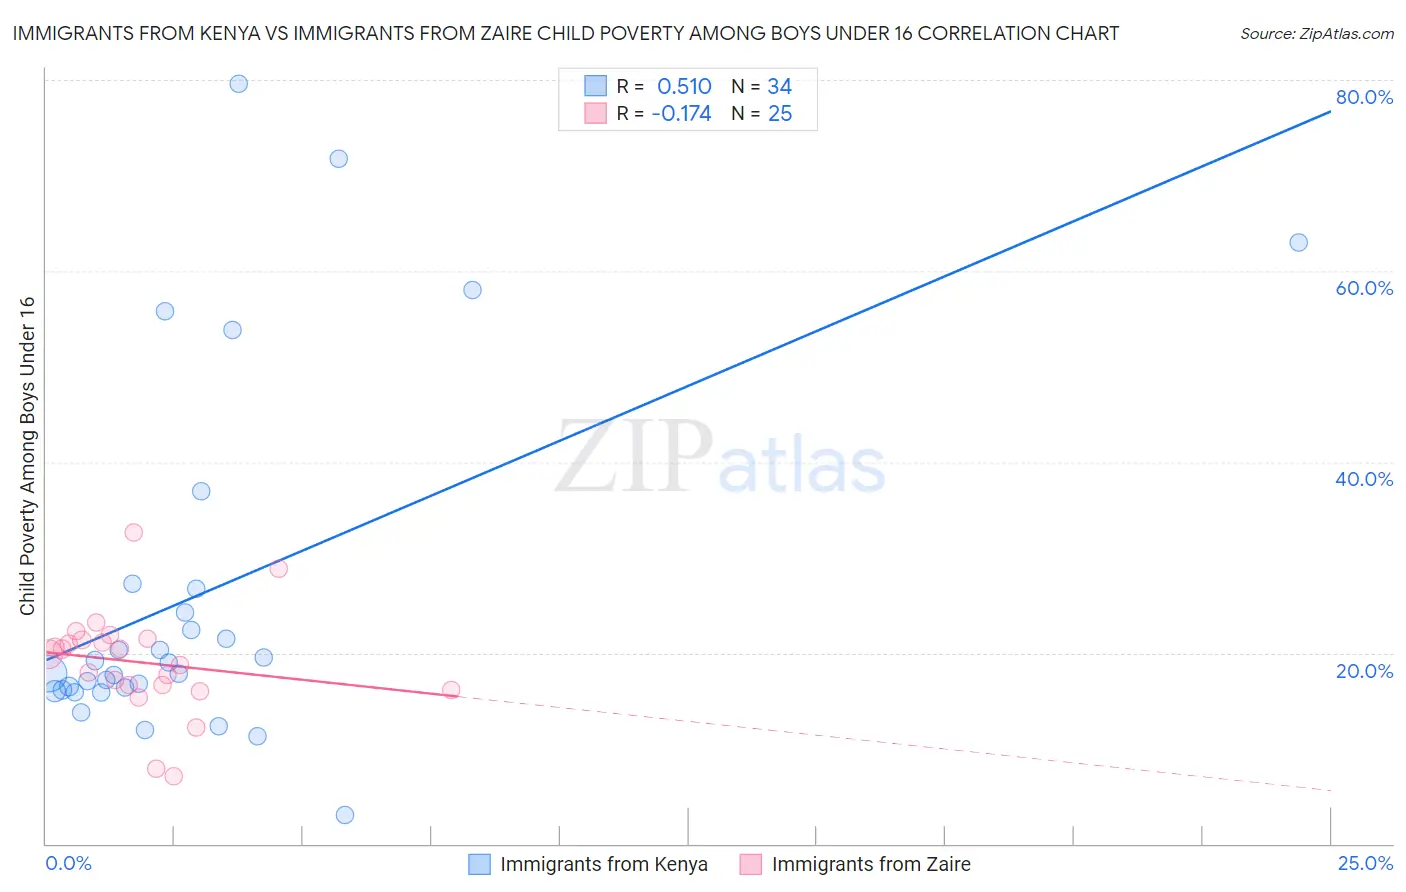
Immigrants from Kenya vs Immigrants from Zaire Child Poverty Among Boys Under 16 Correlation Chart

The statistical analysis conducted on geographies consisting of 216,714,978 people shows a substantial positive correlation between the proportion of Immigrants from Kenya and poverty level among boys under the age of 16 in the United States with a correlation coefficient (R) of 0.510 and weighted average of 17.1%. Similarly, the statistical analysis conducted on geographies consisting of 107,061,350 people shows a poor negative correlation between the proportion of Immigrants from Zaire and poverty level among boys under the age of 16 in the United States with a correlation coefficient (R) of -0.174 and weighted average of 20.1%, a difference of 17.6%.
Immigrants from Kenya vs Immigrants from Zaire Child Poverty Among Boys Under 16

Child Poverty Among Boys Under 16 Correlation Summary

MeasurementImmigrants from KenyaImmigrants from Zaire
Minimum3.0%7.0%
Maximum79.6%32.7%
Range76.5%25.6%
Mean26.2%19.0%
Median18.3%19.9%
Interquartile 25% (IQ1)16.1%16.4%
Interquartile 75% (IQ3)26.8%21.4%
Interquartile Range (IQR)10.7%5.1%
Standard Deviation (Sample)18.8%5.4%
Standard Deviation (Population)18.5%5.3%

Similar Demographics by Child Poverty Among Boys Under 16

Demographics Similar to Immigrants from Kenya by Child Poverty Among Boys Under 16

In terms of child poverty among boys under 16, the demographic groups most similar to Immigrants from Kenya are Spaniard (17.1%, a difference of 0.060%), Spanish (17.0%, a difference of 0.11%), Immigrants from Lebanon (17.0%, a difference of 0.18%), Immigrants from Cameroon (17.1%, a difference of 0.19%), and Delaware (17.1%, a difference of 0.23%).
DemographicsRating | RankChild Poverty Among Boys Under 16
Arabs
31.1
/100
|
#190
Fair
16.8%
Alaska Natives
29.8
/100
|
#191
Fair
16.8%
Immigrants | Uganda
21.6
/100
|
#192
Fair
17.0%
Immigrants | Iraq
21.6
/100
|
#193
Fair
17.0%
Immigrants | Lebanon
21.2
/100
|
#194
Fair
17.0%
Spanish
20.8
/100
|
#195
Fair
17.0%
Spaniards
20.5
/100
|
#196
Fair
17.1%
Immigrants | Kenya
20.1
/100
|
#197
Fair
17.1%
Immigrants | Cameroon
19.0
/100
|
#198
Poor
17.1%
Delaware
18.8
/100
|
#199
Poor
17.1%
Immigrants | Uruguay
16.9
/100
|
#200
Poor
17.2%
Immigrants | Afghanistan
13.7
/100
|
#201
Poor
17.3%
Immigrants | Sierra Leone
13.4
/100
|
#202
Poor
17.3%
Immigrants | Uzbekistan
13.3
/100
|
#203
Poor
17.3%
Ugandans
12.5
/100
|
#204
Poor
17.3%

Demographics Similar to Immigrants from Zaire by Child Poverty Among Boys Under 16

In terms of child poverty among boys under 16, the demographic groups most similar to Immigrants from Zaire are Comanche (20.1%, a difference of 0.050%), Central American (20.1%, a difference of 0.060%), Bangladeshi (20.0%, a difference of 0.18%), Immigrants from Jamaica (20.1%, a difference of 0.18%), and Immigrants from West Indies (20.0%, a difference of 0.31%).
DemographicsRating | RankChild Poverty Among Boys Under 16
Immigrants | Bangladesh
0.0
/100
|
#274
Tragic
19.9%
Jamaicans
0.0
/100
|
#275
Tragic
20.0%
Sub-Saharan Africans
0.0
/100
|
#276
Tragic
20.0%
Immigrants | Barbados
0.0
/100
|
#277
Tragic
20.0%
Immigrants | West Indies
0.0
/100
|
#278
Tragic
20.0%
Bangladeshis
0.0
/100
|
#279
Tragic
20.0%
Central Americans
0.0
/100
|
#280
Tragic
20.1%
Immigrants | Zaire
0.0
/100
|
#281
Tragic
20.1%
Comanche
0.0
/100
|
#282
Tragic
20.1%
Immigrants | Jamaica
0.0
/100
|
#283
Tragic
20.1%
Barbadians
0.0
/100
|
#284
Tragic
20.2%
Arapaho
0.0
/100
|
#285
Tragic
20.2%
West Indians
0.0
/100
|
#286
Tragic
20.3%
Immigrants | Belize
0.0
/100
|
#287
Tragic
20.3%
Immigrants | St. Vincent and the Grenadines
0.0
/100
|
#288
Tragic
20.3%