Immigrants from Italy vs Nicaraguan Single Male Poverty
COMPARE
Immigrants from Italy
Nicaraguan
Single Male Poverty
Single Male Poverty Comparison
Immigrants from Italy
Nicaraguans
12.2%
SINGLE MALE POVERTY
97.4/ 100
METRIC RATING
97th/ 347
METRIC RANK
12.4%
SINGLE MALE POVERTY
92.1/ 100
METRIC RATING
114th/ 347
METRIC RANK
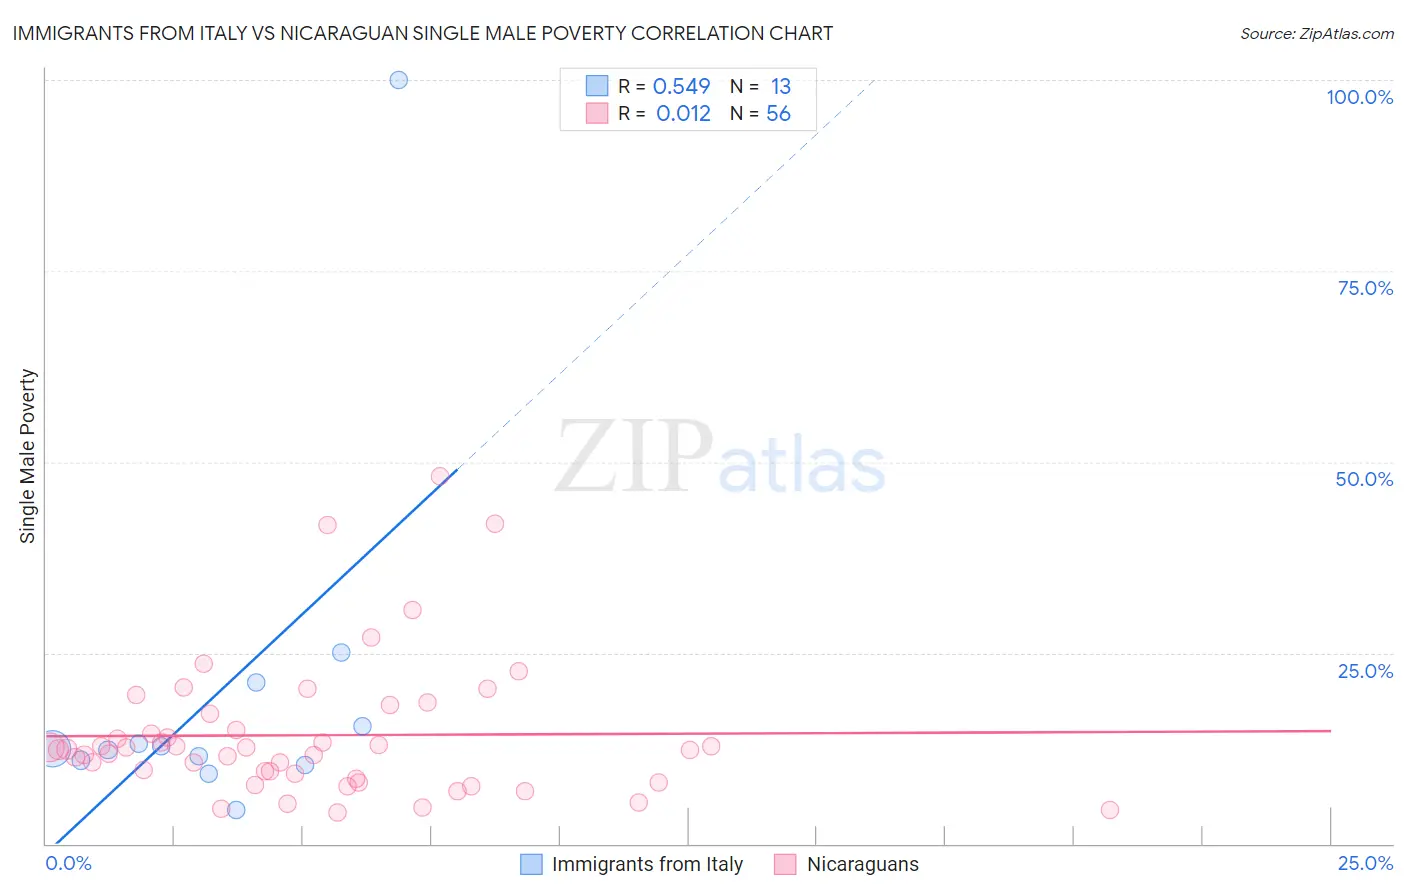
Immigrants from Italy vs Nicaraguan Single Male Poverty Correlation Chart
The statistical analysis conducted on geographies consisting of 286,137,274 people shows a substantial positive correlation between the proportion of Immigrants from Italy and poverty level among single males in the United States with a correlation coefficient (R) of 0.549 and weighted average of 12.2%. Similarly, the statistical analysis conducted on geographies consisting of 265,372,513 people shows no correlation between the proportion of Nicaraguans and poverty level among single males in the United States with a correlation coefficient (R) of 0.012 and weighted average of 12.4%, a difference of 1.6%.
Single Male Poverty Correlation Summary
| Measurement | Immigrants from Italy | Nicaraguan |
| Minimum | 4.4% | 4.1% |
| Maximum | 100.0% | 48.1% |
| Range | 95.6% | 44.0% |
| Mean | 19.9% | 14.2% |
| Median | 12.4% | 12.4% |
| Interquartile 25% (IQ1) | 10.7% | 8.9% |
| Interquartile 75% (IQ3) | 18.2% | 16.0% |
| Interquartile Range (IQR) | 7.6% | 7.1% |
| Standard Deviation (Sample) | 24.6% | 9.1% |
| Standard Deviation (Population) | 23.7% | 9.0% |
Demographics Similar to Immigrants from Italy and Nicaraguans by Single Male Poverty
In terms of single male poverty, the demographic groups most similar to Immigrants from Italy are Guamanian/Chamorro (12.2%, a difference of 0.0%), Immigrants from Cuba (12.2%, a difference of 0.040%), Immigrants from Sweden (12.2%, a difference of 0.050%), Immigrants from Australia (12.2%, a difference of 0.16%), and Immigrants from Latvia (12.2%, a difference of 0.19%). Similarly, the demographic groups most similar to Nicaraguans are Pakistani (12.4%, a difference of 0.050%), Immigrants from Southern Europe (12.4%, a difference of 0.11%), Kenyan (12.4%, a difference of 0.23%), Immigrants from Portugal (12.3%, a difference of 0.30%), and Immigrants from North Macedonia (12.3%, a difference of 0.30%).
| Demographics | Rating | Rank | Single Male Poverty |
| Mongolians | 97.7 /100 | #95 | Exceptional 12.2% |
| Immigrants | Sweden | 97.5 /100 | #96 | Exceptional 12.2% |
| Immigrants | Italy | 97.4 /100 | #97 | Exceptional 12.2% |
| Guamanians/Chamorros | 97.4 /100 | #98 | Exceptional 12.2% |
| Immigrants | Cuba | 97.3 /100 | #99 | Exceptional 12.2% |
| Immigrants | Australia | 97.1 /100 | #100 | Exceptional 12.2% |
| Immigrants | Latvia | 97.0 /100 | #101 | Exceptional 12.2% |
| Immigrants | Europe | 97.0 /100 | #102 | Exceptional 12.2% |
| Immigrants | Armenia | 96.7 /100 | #103 | Exceptional 12.2% |
| Immigrants | Kazakhstan | 96.7 /100 | #104 | Exceptional 12.2% |
| Jordanians | 95.9 /100 | #105 | Exceptional 12.3% |
| Immigrants | Morocco | 95.6 /100 | #106 | Exceptional 12.3% |
| Iraqis | 95.1 /100 | #107 | Exceptional 12.3% |
| Immigrants | Eastern Africa | 95.0 /100 | #108 | Exceptional 12.3% |
| Ugandans | 94.5 /100 | #109 | Exceptional 12.3% |
| Immigrants | Portugal | 93.6 /100 | #110 | Exceptional 12.3% |
| Immigrants | North Macedonia | 93.6 /100 | #111 | Exceptional 12.3% |
| Kenyans | 93.3 /100 | #112 | Exceptional 12.4% |
| Pakistanis | 92.4 /100 | #113 | Exceptional 12.4% |
| Nicaraguans | 92.1 /100 | #114 | Exceptional 12.4% |
| Immigrants | Southern Europe | 91.5 /100 | #115 | Exceptional 12.4% |