Immigrants from Italy vs Immigrants from Albania Child Poverty Among Boys Under 16

COMPARE

Immigrants from Italy
Race
Ancestry
AfghanAfricanAlaska NativeAlaskan AthabascanAlbanianAleutAlsatianAmericanApacheArabArapahoArgentineanArmenianAssyrian/Chaldean/SyriacAustralianAustrianBahamianBangladeshiBarbadianBasqueBelgianBelizeanBermudanBhutaneseBlackfeetBolivianBrazilianBritishBritish West IndianBulgarianBurmeseCajunCambodianCanadianCape VerdeanCarpatho RusynCelticCentral AmericanCentral American IndianCherokeeCheyenneChickasawChileanChineseChippewaChoctawColombianColvilleComancheCosta RicanCreeCreekCroatianCrowCubanCypriotCzechCzechoslovakianDanishDelawareDominicanDutchDutch West IndianEastern EuropeanEcuadorianEgyptianEnglishEstonianEthiopianEuropeanFijianFilipinoFinnishFrenchFrench American IndianFrench CanadianGermanGerman RussianGhanaianGreekGuamanian/ChamorroGuatemalanGuyaneseHaitianHmongHonduranHopiHoumaHungarianIcelanderIndian (Asian)IndonesianInupiatIranianIraqiIrishIroquoisIsraeliItalianJamaicanJapaneseJordanianKenyanKiowaKoreanLaotianLatvianLebaneseLiberianLithuanianLumbeeLuxembourgerMacedonianMalaysianMalteseMarshalleseMenomineeMexicanMexican American IndianMongolianMoroccanNative HawaiianNavajoNepaleseNew ZealanderNicaraguanNigerianNorthern EuropeanNorwegianOkinawanOsageOttawaPaiutePakistaniPalestinianPanamanianParaguayanPennsylvania GermanPeruvianPimaPolishPortuguesePotawatomiPuebloPuerto RicanPuget Sound SalishRomanianRussianSalvadoranSamoanScandinavianScotch-IrishScottishSeminoleSenegaleseSerbianShoshoneSierra LeoneanSiouxSlavicSlovakSloveneSomaliSouth AfricanSouth AmericanSouth American IndianSoviet UnionSpaniardSpanishSpanish AmericanSpanish American IndianSri LankanSubsaharan AfricanSudaneseSwedishSwissSyrianTaiwaneseThaiTlingit-HaidaTohono O'OdhamTonganTrinidadian and TobagonianTsimshianTurkishU.S. Virgin IslanderUgandanUkrainianUruguayanUteVenezuelanVietnameseWelshWest IndianYakamaYaquiYugoslavianYumanYup'ikZimbabwean
Immigration
NonimmigrantsImmigrantsAfghanistanAfricaArgentinaArmeniaAsiaAustraliaAustriaBahamasBangladeshBarbadosBelarusBelgiumBelizeBoliviaBosnia and HerzegovinaBrazilBulgariaBurma/MyanmarCabo VerdeCambodiaCameroonCanadaCaribbeanCentral AmericaChileChinaColombiaCongoCosta RicaCroatiaCubaCzechoslovakiaDenmarkDominicaDominican RepublicEastern AfricaEastern AsiaEastern EuropeEcuadorEgyptEl SalvadorEnglandEritreaEthiopiaEuropeFijiFranceGermanyGhanaGreeceGrenadaGuatemalaGuyanaHaitiHondurasHong KongHungaryIndiaIndonesiaIranIraqIrelandIsraelItalyJamaicaJapanJordanKazakhstanKenyaKoreaKuwaitLaosLatin AmericaLatviaLebanonLiberiaLithuaniaMalaysiaMexicoMicronesiaMiddle AfricaMoldovaMoroccoNepalNetherlandsNicaraguaNigeriaNorth AmericaNorth MacedoniaNorthern AfricaNorthern EuropeNorwayOceaniaPakistanPanamaPeruPhilippinesPolandPortugalRomaniaRussiaSaudi ArabiaScotlandSenegalSerbiaSierra LeoneSingaporeSomaliaSouth AfricaSouth AmericaSouth Central AsiaSouth Eastern AsiaSouthern EuropeSpainSri LankaSt. Vincent and the GrenadinesSudanSwedenSwitzerlandSyriaTaiwanThailandTrinidad and TobagoTurkeyUgandaUkraineUruguayUzbekistanVenezuelaVietnamWest IndiesWestern AfricaWestern AsiaWestern EuropeYemenZaireZimbabweAzores
Immigrants from Albania
Race
Ancestry
AfghanAfricanAlaska NativeAlaskan AthabascanAlbanianAleutAlsatianAmericanApacheArabArapahoArgentineanArmenianAssyrian/Chaldean/SyriacAustralianAustrianBahamianBangladeshiBarbadianBasqueBelgianBelizeanBermudanBhutaneseBlackfeetBolivianBrazilianBritishBritish West IndianBulgarianBurmeseCajunCambodianCanadianCape VerdeanCarpatho RusynCelticCentral AmericanCentral American IndianCherokeeCheyenneChickasawChileanChineseChippewaChoctawColombianColvilleComancheCosta RicanCreeCreekCroatianCrowCubanCypriotCzechCzechoslovakianDanishDelawareDominicanDutchDutch West IndianEastern EuropeanEcuadorianEgyptianEnglishEstonianEthiopianEuropeanFijianFilipinoFinnishFrenchFrench American IndianFrench CanadianGermanGerman RussianGhanaianGreekGuamanian/ChamorroGuatemalanGuyaneseHaitianHmongHonduranHopiHoumaHungarianIcelanderIndian (Asian)IndonesianInupiatIranianIraqiIrishIroquoisIsraeliItalianJamaicanJapaneseJordanianKenyanKiowaKoreanLaotianLatvianLebaneseLiberianLithuanianLumbeeLuxembourgerMacedonianMalaysianMalteseMarshalleseMenomineeMexicanMexican American IndianMongolianMoroccanNative HawaiianNavajoNepaleseNew ZealanderNicaraguanNigerianNorthern EuropeanNorwegianOkinawanOsageOttawaPaiutePakistaniPalestinianPanamanianParaguayanPennsylvania GermanPeruvianPimaPolishPortuguesePotawatomiPuebloPuerto RicanPuget Sound SalishRomanianRussianSalvadoranSamoanScandinavianScotch-IrishScottishSeminoleSenegaleseSerbianShoshoneSierra LeoneanSiouxSlavicSlovakSloveneSomaliSouth AfricanSouth AmericanSouth American IndianSoviet UnionSpaniardSpanishSpanish AmericanSpanish American IndianSri LankanSubsaharan AfricanSudaneseSwedishSwissSyrianTaiwaneseThaiTlingit-HaidaTohono O'OdhamTonganTrinidadian and TobagonianTsimshianTurkishU.S. Virgin IslanderUgandanUkrainianUruguayanUteVenezuelanVietnameseWelshWest IndianYakamaYaquiYugoslavianYumanYup'ikZimbabwean
Immigration
NonimmigrantsImmigrantsAfghanistanAfricaAlbaniaArgentinaArmeniaAsiaAustraliaAustriaBahamasBangladeshBarbadosBelarusBelgiumBelizeBoliviaBosnia and HerzegovinaBrazilBulgariaBurma/MyanmarCabo VerdeCambodiaCameroonCanadaCaribbeanCentral AmericaChileChinaColombiaCongoCosta RicaCroatiaCubaCzechoslovakiaDenmarkDominicaDominican RepublicEastern AfricaEastern AsiaEastern EuropeEcuadorEgyptEl SalvadorEnglandEritreaEthiopiaEuropeFijiFranceGermanyGhanaGreeceGrenadaGuatemalaGuyanaHaitiHondurasHong KongHungaryIndiaIndonesiaIranIraqIrelandIsraelJamaicaJapanJordanKazakhstanKenyaKoreaKuwaitLaosLatin AmericaLatviaLebanonLiberiaLithuaniaMalaysiaMexicoMicronesiaMiddle AfricaMoldovaMoroccoNepalNetherlandsNicaraguaNigeriaNorth AmericaNorth MacedoniaNorthern AfricaNorthern EuropeNorwayOceaniaPakistanPanamaPeruPhilippinesPolandPortugalRomaniaRussiaSaudi ArabiaScotlandSenegalSerbiaSierra LeoneSingaporeSomaliaSouth AfricaSouth AmericaSouth Central AsiaSouth Eastern AsiaSouthern EuropeSpainSri LankaSt. Vincent and the GrenadinesSudanSwedenSwitzerlandSyriaTaiwanThailandTrinidad and TobagoTurkeyUgandaUkraineUruguayUzbekistanVenezuelaVietnamWest IndiesWestern AfricaWestern AsiaWestern EuropeYemenZaireZimbabweAzores
Child Poverty Among Boys Under 16
Income
Poverty
Unemployment
Labor Participation
Family Structure
Vehicle Availability
Education Level
Disability

Child Poverty Among Boys Under 16 Comparison

Immigrants from Italy

Immigrants from Albania

Exceptional
Good
14.9%
CHILD POVERTY AMONG BOYS UNDER 16
96.7/ 100
METRIC RATING
94th/ 347
METRIC RANK
16.1%
CHILD POVERTY AMONG BOYS UNDER 16
67.9/ 100
METRIC RATING
164th/ 347
METRIC RANK

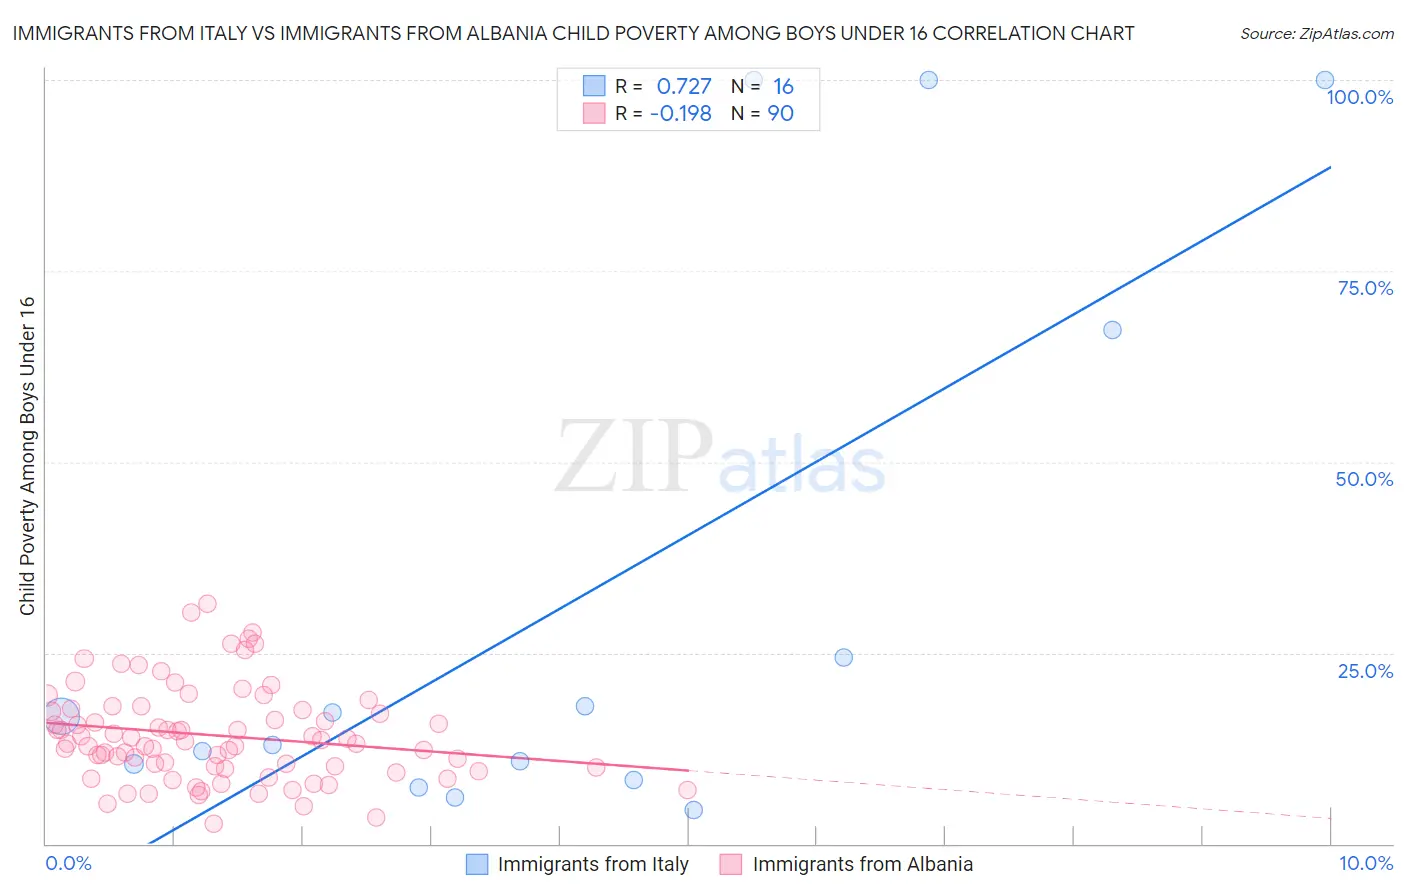
Immigrants from Italy vs Immigrants from Albania Child Poverty Among Boys Under 16 Correlation Chart

The statistical analysis conducted on geographies consisting of 317,774,656 people shows a strong positive correlation between the proportion of Immigrants from Italy and poverty level among boys under the age of 16 in the United States with a correlation coefficient (R) of 0.727 and weighted average of 14.9%. Similarly, the statistical analysis conducted on geographies consisting of 118,372,519 people shows a poor negative correlation between the proportion of Immigrants from Albania and poverty level among boys under the age of 16 in the United States with a correlation coefficient (R) of -0.198 and weighted average of 16.1%, a difference of 8.1%.
Immigrants from Italy vs Immigrants from Albania Child Poverty Among Boys Under 16

Child Poverty Among Boys Under 16 Correlation Summary

MeasurementImmigrants from ItalyImmigrants from Albania
Minimum4.4%2.7%
Maximum100.0%31.4%
Range95.6%28.7%
Mean32.2%14.2%
Median14.8%13.2%
Interquartile 25% (IQ1)9.4%9.9%
Interquartile 75% (IQ3)45.8%17.5%
Interquartile Range (IQR)36.4%7.5%
Standard Deviation (Sample)36.6%6.1%
Standard Deviation (Population)35.4%6.1%

Similar Demographics by Child Poverty Among Boys Under 16

Demographics Similar to Immigrants from Italy by Child Poverty Among Boys Under 16

In terms of child poverty among boys under 16, the demographic groups most similar to Immigrants from Italy are Sri Lankan (14.9%, a difference of 0.0%), Argentinean (14.9%, a difference of 0.050%), Finnish (14.9%, a difference of 0.10%), Paraguayan (14.9%, a difference of 0.13%), and Immigrants from North Macedonia (14.9%, a difference of 0.36%).
DemographicsRating | RankChild Poverty Among Boys Under 16
Northern Europeans
97.2
/100
|
#87
Exceptional
14.8%
Immigrants | North America
97.1
/100
|
#88
Exceptional
14.8%
Immigrants | Argentina
97.1
/100
|
#89
Exceptional
14.8%
Austrians
97.1
/100
|
#90
Exceptional
14.8%
Paraguayans
96.8
/100
|
#91
Exceptional
14.9%
Argentineans
96.7
/100
|
#92
Exceptional
14.9%
Sri Lankans
96.7
/100
|
#93
Exceptional
14.9%
Immigrants | Italy
96.7
/100
|
#94
Exceptional
14.9%
Finns
96.5
/100
|
#95
Exceptional
14.9%
Immigrants | North Macedonia
96.3
/100
|
#96
Exceptional
14.9%
Immigrants | Egypt
96.2
/100
|
#97
Exceptional
14.9%
British
96.2
/100
|
#98
Exceptional
15.0%
Immigrants | France
96.1
/100
|
#99
Exceptional
15.0%
Chileans
95.8
/100
|
#100
Exceptional
15.0%
Immigrants | Belarus
95.7
/100
|
#101
Exceptional
15.0%

Demographics Similar to Immigrants from Albania by Child Poverty Among Boys Under 16

In terms of child poverty among boys under 16, the demographic groups most similar to Immigrants from Albania are Costa Rican (16.1%, a difference of 0.020%), Guamanian/Chamorro (16.1%, a difference of 0.22%), Colombian (16.1%, a difference of 0.35%), Immigrants from Oceania (16.0%, a difference of 0.45%), and Immigrants from Northern Africa (16.0%, a difference of 0.46%).
DemographicsRating | RankChild Poverty Among Boys Under 16
Immigrants | Nepal
76.0
/100
|
#157
Good
15.9%
Yugoslavians
75.9
/100
|
#158
Good
15.9%
Immigrants | Chile
74.8
/100
|
#159
Good
15.9%
Immigrants | Northern Africa
71.3
/100
|
#160
Good
16.0%
Immigrants | Oceania
71.3
/100
|
#161
Good
16.0%
Guamanians/Chamorros
69.6
/100
|
#162
Good
16.1%
Costa Ricans
68.1
/100
|
#163
Good
16.1%
Immigrants | Albania
67.9
/100
|
#164
Good
16.1%
Colombians
65.2
/100
|
#165
Good
16.1%
Immigrants | Germany
63.6
/100
|
#166
Good
16.2%
Afghans
55.4
/100
|
#167
Average
16.3%
South Americans
55.3
/100
|
#168
Average
16.3%
Immigrants | Saudi Arabia
53.6
/100
|
#169
Average
16.4%
Immigrants | Bosnia and Herzegovina
51.7
/100
|
#170
Average
16.4%
Immigrants | Ethiopia
51.3
/100
|
#171
Average
16.4%