Immigrants from Iraq vs Spanish Female Poverty Among 18-24 Year Olds

COMPARE

Immigrants from Iraq
Race
Ancestry
AfghanAfricanAlaska NativeAlaskan AthabascanAlbanianAleutAlsatianAmericanApacheArabArapahoArgentineanArmenianAssyrian/Chaldean/SyriacAustralianAustrianBahamianBangladeshiBarbadianBasqueBelgianBelizeanBermudanBhutaneseBlackfeetBolivianBrazilianBritishBritish West IndianBulgarianBurmeseCajunCambodianCanadianCape VerdeanCarpatho RusynCelticCentral AmericanCentral American IndianCherokeeCheyenneChickasawChileanChineseChippewaChoctawColombianColvilleComancheCosta RicanCreeCreekCroatianCrowCubanCypriotCzechCzechoslovakianDanishDelawareDominicanDutchDutch West IndianEastern EuropeanEcuadorianEgyptianEnglishEstonianEthiopianEuropeanFijianFilipinoFinnishFrenchFrench American IndianFrench CanadianGermanGerman RussianGhanaianGreekGuamanian/ChamorroGuatemalanGuyaneseHaitianHmongHonduranHopiHoumaHungarianIcelanderIndian (Asian)IndonesianInupiatIranianIraqiIrishIroquoisIsraeliItalianJamaicanJapaneseJordanianKenyanKiowaKoreanLaotianLatvianLebaneseLiberianLithuanianLumbeeLuxembourgerMacedonianMalaysianMalteseMarshalleseMenomineeMexicanMexican American IndianMongolianMoroccanNative HawaiianNavajoNepaleseNew ZealanderNicaraguanNigerianNorthern EuropeanNorwegianOkinawanOsageOttawaPaiutePakistaniPalestinianPanamanianParaguayanPennsylvania GermanPeruvianPimaPolishPortuguesePotawatomiPuebloPuerto RicanPuget Sound SalishRomanianRussianSalvadoranSamoanScandinavianScotch-IrishScottishSeminoleSenegaleseSerbianShoshoneSierra LeoneanSiouxSlavicSlovakSloveneSomaliSouth AfricanSouth AmericanSouth American IndianSoviet UnionSpaniardSpanish AmericanSpanish American IndianSri LankanSubsaharan AfricanSudaneseSwedishSwissSyrianTaiwaneseThaiTlingit-HaidaTohono O'OdhamTonganTrinidadian and TobagonianTsimshianTurkishU.S. Virgin IslanderUgandanUkrainianUruguayanUteVenezuelanVietnameseWelshWest IndianYakamaYaquiYugoslavianYumanYup'ikZimbabwean
Immigration
NonimmigrantsImmigrantsAfghanistanAfricaAlbaniaArgentinaArmeniaAsiaAustraliaAustriaBahamasBangladeshBarbadosBelarusBelgiumBelizeBoliviaBosnia and HerzegovinaBrazilBulgariaBurma/MyanmarCabo VerdeCambodiaCameroonCanadaCaribbeanCentral AmericaChileChinaColombiaCongoCosta RicaCroatiaCubaCzechoslovakiaDenmarkDominicaDominican RepublicEastern AfricaEastern AsiaEastern EuropeEcuadorEgyptEl SalvadorEnglandEritreaEthiopiaEuropeFijiFranceGermanyGhanaGreeceGrenadaGuatemalaGuyanaHaitiHondurasHong KongHungaryIndiaIndonesiaIranIraqIrelandIsraelItalyJamaicaJapanJordanKazakhstanKenyaKoreaKuwaitLaosLatin AmericaLatviaLebanonLiberiaLithuaniaMalaysiaMexicoMicronesiaMiddle AfricaMoldovaMoroccoNepalNetherlandsNicaraguaNigeriaNorth AmericaNorth MacedoniaNorthern AfricaNorthern EuropeNorwayOceaniaPakistanPanamaPeruPhilippinesPolandPortugalRomaniaRussiaSaudi ArabiaScotlandSenegalSerbiaSierra LeoneSingaporeSomaliaSouth AfricaSouth AmericaSouth Central AsiaSouth Eastern AsiaSouthern EuropeSpainSri LankaSt. Vincent and the GrenadinesSudanSwedenSwitzerlandSyriaTaiwanThailandTrinidad and TobagoTurkeyUgandaUkraineUruguayUzbekistanVenezuelaVietnamWest IndiesWestern AfricaWestern AsiaWestern EuropeYemenZaireZimbabweAzores
Spanish
Race
Ancestry
AfghanAfricanAlaska NativeAlaskan AthabascanAlbanianAleutAlsatianAmericanApacheArabArapahoArgentineanArmenianAssyrian/Chaldean/SyriacAustralianAustrianBahamianBangladeshiBarbadianBasqueBelgianBelizeanBermudanBhutaneseBlackfeetBolivianBrazilianBritishBritish West IndianBulgarianBurmeseCajunCambodianCanadianCape VerdeanCarpatho RusynCelticCentral AmericanCentral American IndianCherokeeCheyenneChickasawChileanChineseChippewaChoctawColombianColvilleComancheCosta RicanCreeCreekCroatianCrowCubanCypriotCzechCzechoslovakianDanishDelawareDominicanDutchDutch West IndianEastern EuropeanEcuadorianEgyptianEnglishEstonianEthiopianEuropeanFijianFilipinoFinnishFrenchFrench American IndianFrench CanadianGermanGerman RussianGhanaianGreekGuamanian/ChamorroGuatemalanGuyaneseHaitianHmongHonduranHopiHoumaHungarianIcelanderIndian (Asian)IndonesianInupiatIranianIraqiIrishIroquoisIsraeliItalianJamaicanJapaneseJordanianKenyanKiowaKoreanLaotianLatvianLebaneseLiberianLithuanianLumbeeLuxembourgerMacedonianMalaysianMalteseMarshalleseMenomineeMexicanMexican American IndianMongolianMoroccanNative HawaiianNavajoNepaleseNew ZealanderNicaraguanNigerianNorthern EuropeanNorwegianOkinawanOsageOttawaPaiutePakistaniPalestinianPanamanianParaguayanPennsylvania GermanPeruvianPimaPolishPortuguesePotawatomiPuebloPuerto RicanPuget Sound SalishRomanianRussianSalvadoranSamoanScandinavianScotch-IrishScottishSeminoleSenegaleseSerbianShoshoneSierra LeoneanSiouxSlavicSlovakSloveneSomaliSouth AfricanSouth AmericanSouth American IndianSoviet UnionSpaniardSpanishSpanish AmericanSpanish American IndianSri LankanSubsaharan AfricanSudaneseSwedishSwissSyrianTaiwaneseThaiTlingit-HaidaTohono O'OdhamTonganTrinidadian and TobagonianTsimshianTurkishU.S. Virgin IslanderUgandanUkrainianUruguayanUteVenezuelanVietnameseWelshWest IndianYakamaYaquiYugoslavianYumanYup'ikZimbabwean
Immigration
NonimmigrantsImmigrantsAfghanistanAfricaAlbaniaArgentinaArmeniaAsiaAustraliaAustriaBahamasBangladeshBarbadosBelarusBelgiumBelizeBoliviaBosnia and HerzegovinaBrazilBulgariaBurma/MyanmarCabo VerdeCambodiaCameroonCanadaCaribbeanCentral AmericaChileChinaColombiaCongoCosta RicaCroatiaCubaCzechoslovakiaDenmarkDominicaDominican RepublicEastern AfricaEastern AsiaEastern EuropeEcuadorEgyptEl SalvadorEnglandEritreaEthiopiaEuropeFijiFranceGermanyGhanaGreeceGrenadaGuatemalaGuyanaHaitiHondurasHong KongHungaryIndiaIndonesiaIranIrelandIsraelItalyJamaicaJapanJordanKazakhstanKenyaKoreaKuwaitLaosLatin AmericaLatviaLebanonLiberiaLithuaniaMalaysiaMexicoMicronesiaMiddle AfricaMoldovaMoroccoNepalNetherlandsNicaraguaNigeriaNorth AmericaNorth MacedoniaNorthern AfricaNorthern EuropeNorwayOceaniaPakistanPanamaPeruPhilippinesPolandPortugalRomaniaRussiaSaudi ArabiaScotlandSenegalSerbiaSierra LeoneSingaporeSomaliaSouth AfricaSouth AmericaSouth Central AsiaSouth Eastern AsiaSouthern EuropeSpainSri LankaSt. Vincent and the GrenadinesSudanSwedenSwitzerlandSyriaTaiwanThailandTrinidad and TobagoTurkeyUgandaUkraineUruguayUzbekistanVenezuelaVietnamWest IndiesWestern AfricaWestern AsiaWestern EuropeYemenZaireZimbabweAzores
Female Poverty Among 18-24 Year Olds
Income
Poverty
Unemployment
Labor Participation
Family Structure
Vehicle Availability
Education Level
Disability

Female Poverty Among 18-24 Year Olds Comparison

Immigrants from Iraq

Spanish

Exceptional
Poor
18.9%
FEMALE POVERTY AMONG 18-24 YEAR OLDS
99.2/ 100
METRIC RATING
86th/ 347
METRIC RANK
20.6%
FEMALE POVERTY AMONG 18-24 YEAR OLDS
10.4/ 100
METRIC RATING
215th/ 347
METRIC RANK

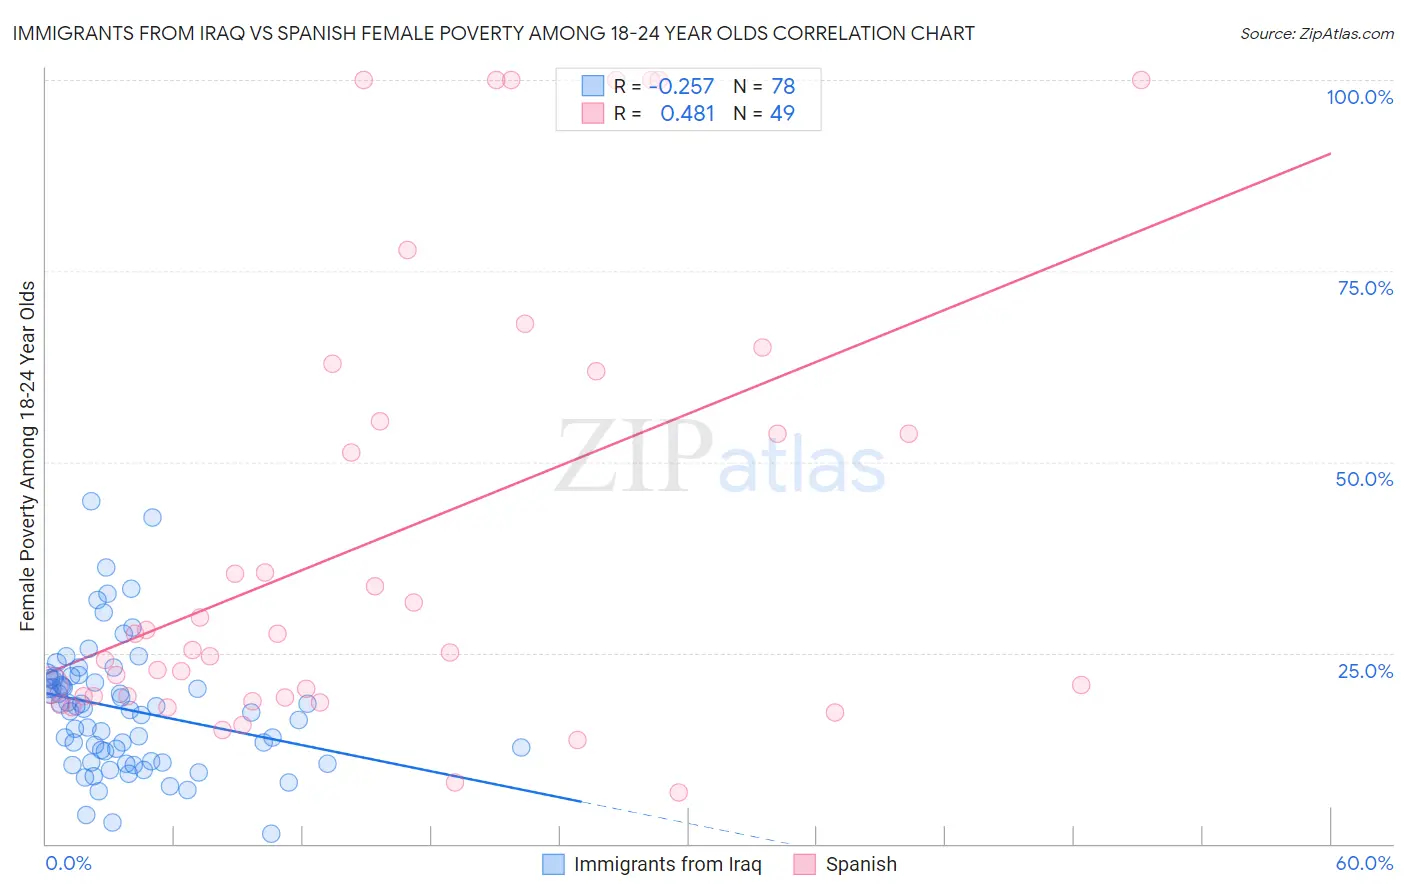
Immigrants from Iraq vs Spanish Female Poverty Among 18-24 Year Olds Correlation Chart

The statistical analysis conducted on geographies consisting of 193,059,376 people shows a weak negative correlation between the proportion of Immigrants from Iraq and poverty level among females between the ages 18 and 24 in the United States with a correlation coefficient (R) of -0.257 and weighted average of 18.9%. Similarly, the statistical analysis conducted on geographies consisting of 411,092,173 people shows a moderate positive correlation between the proportion of Spanish and poverty level among females between the ages 18 and 24 in the United States with a correlation coefficient (R) of 0.481 and weighted average of 20.6%, a difference of 9.0%.
Immigrants from Iraq vs Spanish Female Poverty Among 18-24 Year Olds

Female Poverty Among 18-24 Year Olds Correlation Summary

MeasurementImmigrants from IraqSpanish
Minimum1.3%6.7%
Maximum44.8%100.0%
Range43.5%93.3%
Mean17.6%40.2%
Median17.5%25.3%
Interquartile 25% (IQ1)10.8%19.2%
Interquartile 75% (IQ3)21.6%58.6%
Interquartile Range (IQR)10.8%39.4%
Standard Deviation (Sample)8.3%29.6%
Standard Deviation (Population)8.3%29.3%

Similar Demographics by Female Poverty Among 18-24 Year Olds

Demographics Similar to Immigrants from Iraq by Female Poverty Among 18-24 Year Olds

In terms of female poverty among 18-24 year olds, the demographic groups most similar to Immigrants from Iraq are Immigrants from Jamaica (18.9%, a difference of 0.010%), Immigrants from Armenia (18.9%, a difference of 0.070%), Burmese (18.9%, a difference of 0.11%), Croatian (19.0%, a difference of 0.16%), and Immigrants from Cabo Verde (19.0%, a difference of 0.18%).
DemographicsRating | RankFemale Poverty Among 18-24 Year Olds
Uruguayans
99.5
/100
|
#79
Exceptional
18.8%
Palestinians
99.5
/100
|
#80
Exceptional
18.8%
Japanese
99.5
/100
|
#81
Exceptional
18.8%
Immigrants | Uruguay
99.4
/100
|
#82
Exceptional
18.8%
Immigrants | Indonesia
99.4
/100
|
#83
Exceptional
18.9%
Burmese
99.2
/100
|
#84
Exceptional
18.9%
Immigrants | Armenia
99.2
/100
|
#85
Exceptional
18.9%
Immigrants | Iraq
99.2
/100
|
#86
Exceptional
18.9%
Immigrants | Jamaica
99.2
/100
|
#87
Exceptional
18.9%
Croatians
99.1
/100
|
#88
Exceptional
19.0%
Immigrants | Cabo Verde
99.0
/100
|
#89
Exceptional
19.0%
Afghans
99.0
/100
|
#90
Exceptional
19.0%
Romanians
98.9
/100
|
#91
Exceptional
19.0%
Filipinos
98.9
/100
|
#92
Exceptional
19.0%
Haitians
98.9
/100
|
#93
Exceptional
19.0%

Demographics Similar to Spanish by Female Poverty Among 18-24 Year Olds

In terms of female poverty among 18-24 year olds, the demographic groups most similar to Spanish are Immigrants from Western Africa (20.6%, a difference of 0.020%), Immigrants from South Africa (20.6%, a difference of 0.040%), Immigrants from Laos (20.6%, a difference of 0.090%), Immigrants from Nepal (20.7%, a difference of 0.10%), and Immigrants from Micronesia (20.7%, a difference of 0.11%).
DemographicsRating | RankFemale Poverty Among 18-24 Year Olds
Dutch
15.9
/100
|
#208
Poor
20.5%
Arabs
15.5
/100
|
#209
Poor
20.5%
Immigrants | Ghana
14.3
/100
|
#210
Poor
20.5%
Immigrants | Western Europe
13.5
/100
|
#211
Poor
20.6%
Liberians
11.6
/100
|
#212
Poor
20.6%
Northern Europeans
11.6
/100
|
#213
Poor
20.6%
Immigrants | South Africa
10.7
/100
|
#214
Poor
20.6%
Spanish
10.4
/100
|
#215
Poor
20.6%
Immigrants | Western Africa
10.2
/100
|
#216
Poor
20.6%
Immigrants | Laos
9.7
/100
|
#217
Tragic
20.6%
Immigrants | Nepal
9.6
/100
|
#218
Tragic
20.7%
Immigrants | Micronesia
9.6
/100
|
#219
Tragic
20.7%
British
9.4
/100
|
#220
Tragic
20.7%
Barbadians
9.0
/100
|
#221
Tragic
20.7%
Guatemalans
8.1
/100
|
#222
Tragic
20.7%