Immigrants from Hungary vs Immigrants from Bangladesh Female Poverty Among 18-24 Year Olds

COMPARE

Immigrants from Hungary
Race
Ancestry
AfghanAfricanAlaska NativeAlaskan AthabascanAlbanianAleutAlsatianAmericanApacheArabArapahoArgentineanArmenianAssyrian/Chaldean/SyriacAustralianAustrianBahamianBangladeshiBarbadianBasqueBelgianBelizeanBermudanBhutaneseBlackfeetBolivianBrazilianBritishBritish West IndianBulgarianBurmeseCajunCambodianCanadianCape VerdeanCarpatho RusynCelticCentral AmericanCentral American IndianCherokeeCheyenneChickasawChileanChineseChippewaChoctawColombianColvilleComancheCosta RicanCreeCreekCroatianCrowCubanCypriotCzechCzechoslovakianDanishDelawareDominicanDutchDutch West IndianEastern EuropeanEcuadorianEgyptianEnglishEstonianEthiopianEuropeanFijianFilipinoFinnishFrenchFrench American IndianFrench CanadianGermanGerman RussianGhanaianGreekGuamanian/ChamorroGuatemalanGuyaneseHaitianHmongHonduranHopiHoumaHungarianIcelanderIndian (Asian)IndonesianInupiatIranianIraqiIrishIroquoisIsraeliItalianJamaicanJapaneseJordanianKenyanKiowaKoreanLaotianLatvianLebaneseLiberianLithuanianLumbeeLuxembourgerMacedonianMalaysianMalteseMarshalleseMenomineeMexicanMexican American IndianMongolianMoroccanNative HawaiianNavajoNepaleseNew ZealanderNicaraguanNigerianNorthern EuropeanNorwegianOkinawanOsageOttawaPaiutePakistaniPalestinianPanamanianParaguayanPennsylvania GermanPeruvianPimaPolishPortuguesePotawatomiPuebloPuerto RicanPuget Sound SalishRomanianRussianSalvadoranSamoanScandinavianScotch-IrishScottishSeminoleSenegaleseSerbianShoshoneSierra LeoneanSiouxSlavicSlovakSloveneSomaliSouth AfricanSouth AmericanSouth American IndianSoviet UnionSpaniardSpanishSpanish AmericanSpanish American IndianSri LankanSubsaharan AfricanSudaneseSwedishSwissSyrianTaiwaneseThaiTlingit-HaidaTohono O'OdhamTonganTrinidadian and TobagonianTsimshianTurkishU.S. Virgin IslanderUgandanUkrainianUruguayanUteVenezuelanVietnameseWelshWest IndianYakamaYaquiYugoslavianYumanYup'ikZimbabwean
Immigration
NonimmigrantsImmigrantsAfghanistanAfricaAlbaniaArgentinaArmeniaAsiaAustraliaAustriaBahamasBarbadosBelarusBelgiumBelizeBoliviaBosnia and HerzegovinaBrazilBulgariaBurma/MyanmarCabo VerdeCambodiaCameroonCanadaCaribbeanCentral AmericaChileChinaColombiaCongoCosta RicaCroatiaCubaCzechoslovakiaDenmarkDominicaDominican RepublicEastern AfricaEastern AsiaEastern EuropeEcuadorEgyptEl SalvadorEnglandEritreaEthiopiaEuropeFijiFranceGermanyGhanaGreeceGrenadaGuatemalaGuyanaHaitiHondurasHong KongHungaryIndiaIndonesiaIranIraqIrelandIsraelItalyJamaicaJapanJordanKazakhstanKenyaKoreaKuwaitLaosLatin AmericaLatviaLebanonLiberiaLithuaniaMalaysiaMexicoMicronesiaMiddle AfricaMoldovaMoroccoNepalNetherlandsNicaraguaNigeriaNorth AmericaNorth MacedoniaNorthern AfricaNorthern EuropeNorwayOceaniaPakistanPanamaPeruPhilippinesPolandPortugalRomaniaRussiaSaudi ArabiaScotlandSenegalSerbiaSierra LeoneSingaporeSomaliaSouth AfricaSouth AmericaSouth Central AsiaSouth Eastern AsiaSouthern EuropeSpainSri LankaSt. Vincent and the GrenadinesSudanSwedenSwitzerlandSyriaTaiwanThailandTrinidad and TobagoTurkeyUgandaUkraineUruguayUzbekistanVenezuelaVietnamWest IndiesWestern AfricaWestern AsiaWestern EuropeYemenZaireZimbabweAzores
Immigrants from Bangladesh
Race
Ancestry
AfghanAfricanAlaska NativeAlaskan AthabascanAlbanianAleutAlsatianAmericanApacheArabArapahoArgentineanArmenianAssyrian/Chaldean/SyriacAustralianAustrianBahamianBangladeshiBarbadianBasqueBelgianBelizeanBermudanBhutaneseBlackfeetBolivianBrazilianBritishBritish West IndianBulgarianBurmeseCajunCambodianCanadianCape VerdeanCarpatho RusynCelticCentral AmericanCentral American IndianCherokeeCheyenneChickasawChileanChineseChippewaChoctawColombianColvilleComancheCosta RicanCreeCreekCroatianCrowCubanCypriotCzechCzechoslovakianDanishDelawareDominicanDutchDutch West IndianEastern EuropeanEcuadorianEgyptianEnglishEstonianEthiopianEuropeanFijianFilipinoFinnishFrenchFrench American IndianFrench CanadianGermanGerman RussianGhanaianGreekGuamanian/ChamorroGuatemalanGuyaneseHaitianHmongHonduranHopiHoumaHungarianIcelanderIndian (Asian)IndonesianInupiatIranianIraqiIrishIroquoisIsraeliItalianJamaicanJapaneseJordanianKenyanKiowaKoreanLaotianLatvianLebaneseLiberianLithuanianLumbeeLuxembourgerMacedonianMalaysianMalteseMarshalleseMenomineeMexicanMexican American IndianMongolianMoroccanNative HawaiianNavajoNepaleseNew ZealanderNicaraguanNigerianNorthern EuropeanNorwegianOkinawanOsageOttawaPaiutePakistaniPalestinianPanamanianParaguayanPennsylvania GermanPeruvianPimaPolishPortuguesePotawatomiPuebloPuerto RicanPuget Sound SalishRomanianRussianSalvadoranSamoanScandinavianScotch-IrishScottishSeminoleSenegaleseSerbianShoshoneSierra LeoneanSiouxSlavicSlovakSloveneSomaliSouth AfricanSouth AmericanSouth American IndianSoviet UnionSpaniardSpanishSpanish AmericanSpanish American IndianSri LankanSubsaharan AfricanSudaneseSwedishSwissSyrianTaiwaneseThaiTlingit-HaidaTohono O'OdhamTonganTrinidadian and TobagonianTsimshianTurkishU.S. Virgin IslanderUgandanUkrainianUruguayanUteVenezuelanVietnameseWelshWest IndianYakamaYaquiYugoslavianYumanYup'ikZimbabwean
Immigration
NonimmigrantsImmigrantsAfghanistanAfricaAlbaniaArgentinaArmeniaAsiaAustraliaAustriaBahamasBangladeshBarbadosBelarusBelgiumBelizeBoliviaBosnia and HerzegovinaBrazilBulgariaBurma/MyanmarCabo VerdeCambodiaCameroonCanadaCaribbeanCentral AmericaChileChinaColombiaCongoCosta RicaCroatiaCubaCzechoslovakiaDenmarkDominicaDominican RepublicEastern AfricaEastern AsiaEastern EuropeEcuadorEgyptEl SalvadorEnglandEritreaEthiopiaEuropeFijiFranceGermanyGhanaGreeceGrenadaGuatemalaGuyanaHaitiHondurasHong KongIndiaIndonesiaIranIraqIrelandIsraelItalyJamaicaJapanJordanKazakhstanKenyaKoreaKuwaitLaosLatin AmericaLatviaLebanonLiberiaLithuaniaMalaysiaMexicoMicronesiaMiddle AfricaMoldovaMoroccoNepalNetherlandsNicaraguaNigeriaNorth AmericaNorth MacedoniaNorthern AfricaNorthern EuropeNorwayOceaniaPakistanPanamaPeruPhilippinesPolandPortugalRomaniaRussiaSaudi ArabiaScotlandSenegalSerbiaSierra LeoneSingaporeSomaliaSouth AfricaSouth AmericaSouth Central AsiaSouth Eastern AsiaSouthern EuropeSpainSri LankaSt. Vincent and the GrenadinesSudanSwedenSwitzerlandSyriaTaiwanThailandTrinidad and TobagoTurkeyUgandaUkraineUruguayUzbekistanVenezuelaVietnamWest IndiesWestern AfricaWestern AsiaWestern EuropeYemenZaireZimbabweAzores
Female Poverty Among 18-24 Year Olds
Income
Poverty
Unemployment
Labor Participation
Family Structure
Vehicle Availability
Education Level
Disability

Female Poverty Among 18-24 Year Olds Comparison

Immigrants from Hungary

Immigrants from Bangladesh

Exceptional
Tragic
19.3%
FEMALE POVERTY AMONG 18-24 YEAR OLDS
96.2/ 100
METRIC RATING
115th/ 347
METRIC RANK
21.8%
FEMALE POVERTY AMONG 18-24 YEAR OLDS
0.1/ 100
METRIC RATING
275th/ 347
METRIC RANK

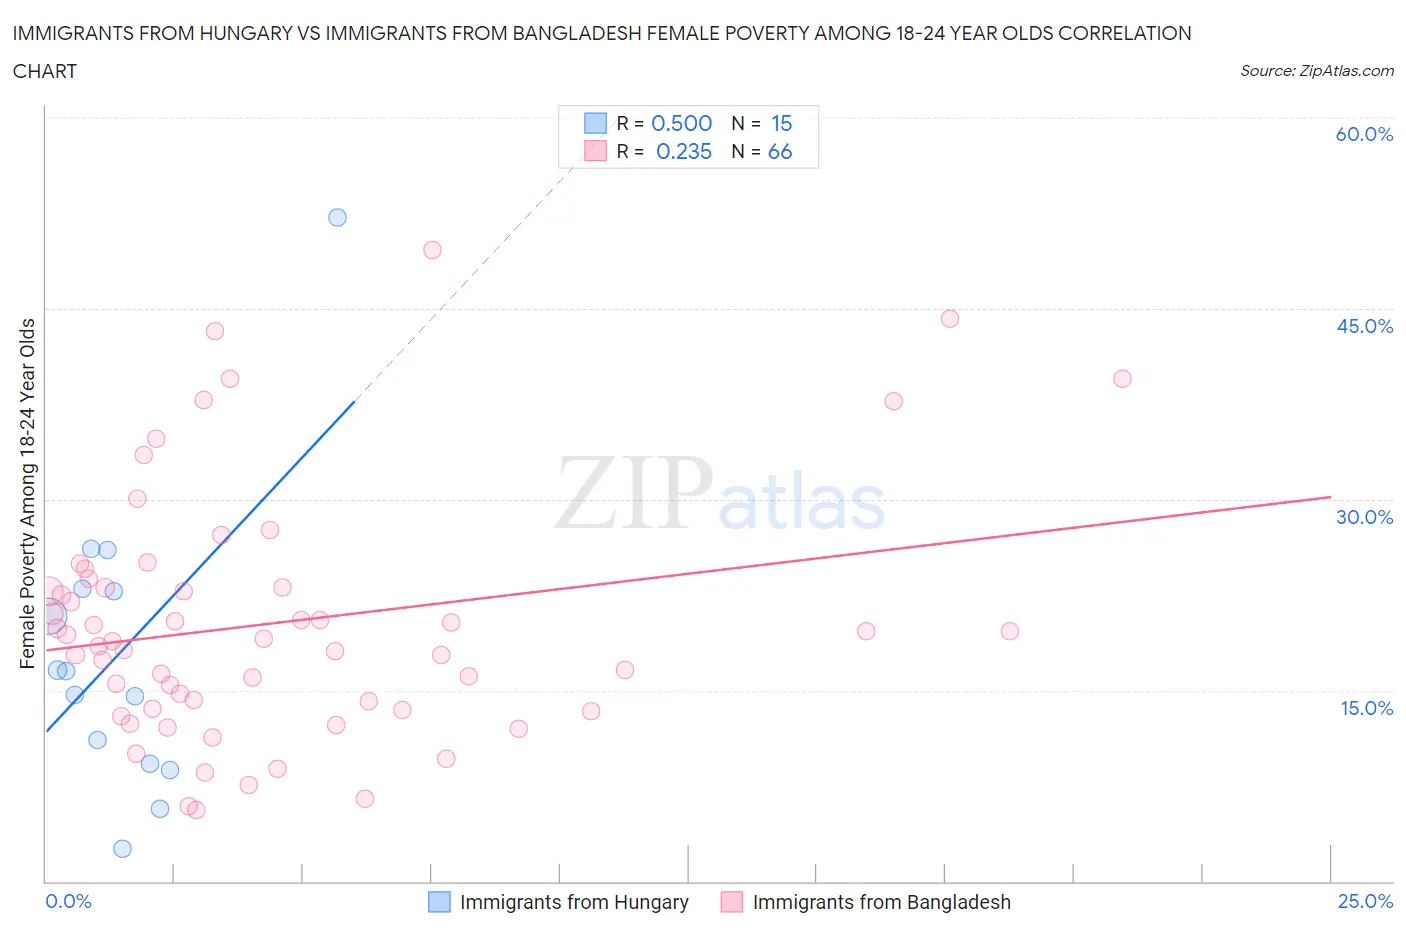
Immigrants from Hungary vs Immigrants from Bangladesh Female Poverty Among 18-24 Year Olds Correlation Chart

The statistical analysis conducted on geographies consisting of 192,436,137 people shows a moderate positive correlation between the proportion of Immigrants from Hungary and poverty level among females between the ages 18 and 24 in the United States with a correlation coefficient (R) of 0.500 and weighted average of 19.3%. Similarly, the statistical analysis conducted on geographies consisting of 201,521,448 people shows a weak positive correlation between the proportion of Immigrants from Bangladesh and poverty level among females between the ages 18 and 24 in the United States with a correlation coefficient (R) of 0.235 and weighted average of 21.8%, a difference of 12.9%.
Immigrants from Hungary vs Immigrants from Bangladesh Female Poverty Among 18-24 Year Olds

Female Poverty Among 18-24 Year Olds Correlation Summary

MeasurementImmigrants from HungaryImmigrants from Bangladesh
Minimum2.6%5.6%
Maximum52.2%49.6%
Range49.6%44.0%
Mean18.0%20.3%
Median16.5%19.0%
Interquartile 25% (IQ1)9.2%13.6%
Interquartile 75% (IQ3)23.0%23.1%
Interquartile Range (IQR)13.7%9.5%
Standard Deviation (Sample)11.9%9.6%
Standard Deviation (Population)11.5%9.6%

Similar Demographics by Female Poverty Among 18-24 Year Olds

Demographics Similar to Immigrants from Hungary by Female Poverty Among 18-24 Year Olds

In terms of female poverty among 18-24 year olds, the demographic groups most similar to Immigrants from Hungary are Slovene (19.3%, a difference of 0.010%), Immigrants from Cameroon (19.3%, a difference of 0.050%), Immigrants (19.3%, a difference of 0.10%), Immigrants from El Salvador (19.3%, a difference of 0.11%), and Immigrants from Iran (19.3%, a difference of 0.14%).
DemographicsRating | RankFemale Poverty Among 18-24 Year Olds
Immigrants | Uzbekistan
97.3
/100
|
#108
Exceptional
19.2%
Immigrants | Syria
97.2
/100
|
#109
Exceptional
19.2%
Laotians
97.1
/100
|
#110
Exceptional
19.2%
Immigrants | Serbia
97.1
/100
|
#111
Exceptional
19.2%
Immigrants | El Salvador
96.5
/100
|
#112
Exceptional
19.3%
Immigrants | Cameroon
96.3
/100
|
#113
Exceptional
19.3%
Slovenes
96.2
/100
|
#114
Exceptional
19.3%
Immigrants | Hungary
96.2
/100
|
#115
Exceptional
19.3%
Immigrants | Immigrants
95.9
/100
|
#116
Exceptional
19.3%
Immigrants | Iran
95.8
/100
|
#117
Exceptional
19.3%
Immigrants | Guyana
95.6
/100
|
#118
Exceptional
19.3%
Cypriots
95.5
/100
|
#119
Exceptional
19.3%
Immigrants | Northern Europe
95.4
/100
|
#120
Exceptional
19.4%
Guyanese
95.3
/100
|
#121
Exceptional
19.4%
Cambodians
94.6
/100
|
#122
Exceptional
19.4%

Demographics Similar to Immigrants from Bangladesh by Female Poverty Among 18-24 Year Olds

In terms of female poverty among 18-24 year olds, the demographic groups most similar to Immigrants from Bangladesh are Bahamian (21.8%, a difference of 0.020%), Immigrants from Honduras (21.8%, a difference of 0.040%), Immigrants from Switzerland (21.8%, a difference of 0.15%), Yaqui (21.9%, a difference of 0.41%), and New Zealander (21.7%, a difference of 0.43%).
DemographicsRating | RankFemale Poverty Among 18-24 Year Olds
Immigrants | Burma/Myanmar
0.2
/100
|
#268
Tragic
21.6%
Celtics
0.2
/100
|
#269
Tragic
21.6%
Mongolians
0.2
/100
|
#270
Tragic
21.6%
Scotch-Irish
0.2
/100
|
#271
Tragic
21.6%
Basques
0.2
/100
|
#272
Tragic
21.7%
New Zealanders
0.2
/100
|
#273
Tragic
21.7%
Immigrants | Honduras
0.1
/100
|
#274
Tragic
21.8%
Immigrants | Bangladesh
0.1
/100
|
#275
Tragic
21.8%
Bahamians
0.1
/100
|
#276
Tragic
21.8%
Immigrants | Switzerland
0.1
/100
|
#277
Tragic
21.8%
Yaqui
0.1
/100
|
#278
Tragic
21.9%
Spanish Americans
0.1
/100
|
#279
Tragic
21.9%
Immigrants | Dominica
0.1
/100
|
#280
Tragic
21.9%
Immigrants | Dominican Republic
0.1
/100
|
#281
Tragic
21.9%
Bermudans
0.1
/100
|
#282
Tragic
21.9%