Immigrants from Honduras vs Immigrants from Indonesia Single Female Poverty
COMPARE
Immigrants from Honduras
Immigrants from Indonesia
Single Female Poverty
Single Female Poverty Comparison
Immigrants from Honduras
Immigrants from Indonesia
25.5%
SINGLE FEMALE POVERTY
0.0/ 100
METRIC RATING
311th/ 347
METRIC RANK
18.9%
SINGLE FEMALE POVERTY
99.8/ 100
METRIC RATING
45th/ 347
METRIC RANK
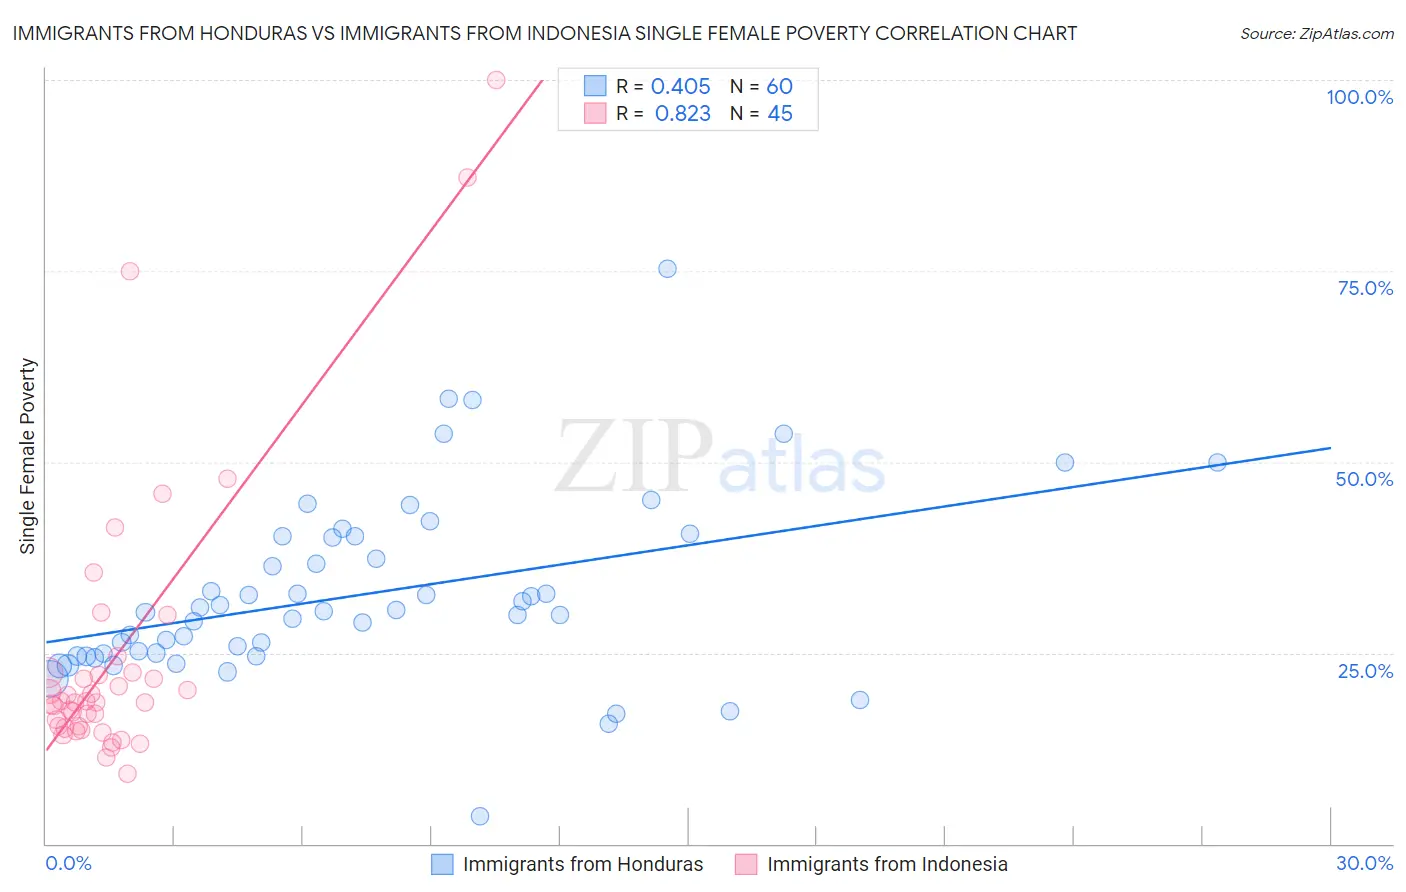
Immigrants from Honduras vs Immigrants from Indonesia Single Female Poverty Correlation Chart
The statistical analysis conducted on geographies consisting of 320,392,656 people shows a moderate positive correlation between the proportion of Immigrants from Honduras and poverty level among single females in the United States with a correlation coefficient (R) of 0.405 and weighted average of 25.5%. Similarly, the statistical analysis conducted on geographies consisting of 213,892,292 people shows a very strong positive correlation between the proportion of Immigrants from Indonesia and poverty level among single females in the United States with a correlation coefficient (R) of 0.823 and weighted average of 18.9%, a difference of 35.0%.
Single Female Poverty Correlation Summary
| Measurement | Immigrants from Honduras | Immigrants from Indonesia |
| Minimum | 3.6% | 9.1% |
| Maximum | 75.2% | 100.0% |
| Range | 71.6% | 90.9% |
| Mean | 32.7% | 24.9% |
| Median | 30.4% | 18.5% |
| Interquartile 25% (IQ1) | 24.7% | 15.2% |
| Interquartile 75% (IQ3) | 40.2% | 22.5% |
| Interquartile Range (IQR) | 15.4% | 7.2% |
| Standard Deviation (Sample) | 12.1% | 19.0% |
| Standard Deviation (Population) | 12.0% | 18.8% |
Similar Demographics by Single Female Poverty
Demographics Similar to Immigrants from Honduras by Single Female Poverty
In terms of single female poverty, the demographic groups most similar to Immigrants from Honduras are Paiute (25.5%, a difference of 0.050%), Comanche (25.6%, a difference of 0.16%), Central American Indian (25.5%, a difference of 0.28%), Dominican (25.4%, a difference of 0.43%), and Aleut (25.4%, a difference of 0.44%).
| Demographics | Rating | Rank | Single Female Poverty |
| Immigrants | Congo | 0.0 /100 | #304 | Tragic 25.3% |
| Immigrants | Dominican Republic | 0.0 /100 | #305 | Tragic 25.3% |
| Immigrants | Mexico | 0.0 /100 | #306 | Tragic 25.3% |
| Potawatomi | 0.0 /100 | #307 | Tragic 25.4% |
| Aleuts | 0.0 /100 | #308 | Tragic 25.4% |
| Dominicans | 0.0 /100 | #309 | Tragic 25.4% |
| Central American Indians | 0.0 /100 | #310 | Tragic 25.5% |
| Immigrants | Honduras | 0.0 /100 | #311 | Tragic 25.5% |
| Paiute | 0.0 /100 | #312 | Tragic 25.5% |
| Comanche | 0.0 /100 | #313 | Tragic 25.6% |
| Cherokee | 0.0 /100 | #314 | Tragic 25.7% |
| Iroquois | 0.0 /100 | #315 | Tragic 25.7% |
| Immigrants | Somalia | 0.0 /100 | #316 | Tragic 25.8% |
| Ottawa | 0.0 /100 | #317 | Tragic 26.0% |
| Chickasaw | 0.0 /100 | #318 | Tragic 26.3% |
Demographics Similar to Immigrants from Indonesia by Single Female Poverty
In terms of single female poverty, the demographic groups most similar to Immigrants from Indonesia are Macedonian (18.9%, a difference of 0.16%), Immigrants from Croatia (18.9%, a difference of 0.21%), Latvian (19.0%, a difference of 0.35%), Immigrants from Romania (18.8%, a difference of 0.38%), and Jordanian (18.8%, a difference of 0.53%).
| Demographics | Rating | Rank | Single Female Poverty |
| Tongans | 99.9 /100 | #38 | Exceptional 18.8% |
| Bulgarians | 99.9 /100 | #39 | Exceptional 18.8% |
| Okinawans | 99.9 /100 | #40 | Exceptional 18.8% |
| Immigrants | Serbia | 99.9 /100 | #41 | Exceptional 18.8% |
| Jordanians | 99.9 /100 | #42 | Exceptional 18.8% |
| Immigrants | Romania | 99.9 /100 | #43 | Exceptional 18.8% |
| Immigrants | Croatia | 99.9 /100 | #44 | Exceptional 18.9% |
| Immigrants | Indonesia | 99.8 /100 | #45 | Exceptional 18.9% |
| Macedonians | 99.8 /100 | #46 | Exceptional 18.9% |
| Latvians | 99.8 /100 | #47 | Exceptional 19.0% |
| Immigrants | Argentina | 99.8 /100 | #48 | Exceptional 19.0% |
| Immigrants | Czechoslovakia | 99.8 /100 | #49 | Exceptional 19.0% |
| Immigrants | Eastern Europe | 99.8 /100 | #50 | Exceptional 19.0% |
| Immigrants | Italy | 99.8 /100 | #51 | Exceptional 19.0% |
| Egyptians | 99.7 /100 | #52 | Exceptional 19.1% |