Immigrants from Guyana vs Soviet Union Poverty

COMPARE

Immigrants from Guyana
Race
Ancestry
AfghanAfricanAlaska NativeAlaskan AthabascanAlbanianAleutAlsatianAmericanApacheArabArapahoArgentineanArmenianAssyrian/Chaldean/SyriacAustralianAustrianBahamianBangladeshiBarbadianBasqueBelgianBelizeanBermudanBhutaneseBlackfeetBolivianBrazilianBritishBritish West IndianBulgarianBurmeseCajunCambodianCanadianCape VerdeanCarpatho RusynCelticCentral AmericanCentral American IndianCherokeeCheyenneChickasawChileanChineseChippewaChoctawColombianColvilleComancheCosta RicanCreeCreekCroatianCrowCubanCypriotCzechCzechoslovakianDanishDelawareDominicanDutchDutch West IndianEastern EuropeanEcuadorianEgyptianEnglishEstonianEthiopianEuropeanFijianFilipinoFinnishFrenchFrench American IndianFrench CanadianGermanGerman RussianGhanaianGreekGuamanian/ChamorroGuatemalanGuyaneseHaitianHmongHonduranHopiHoumaHungarianIcelanderIndian (Asian)IndonesianInupiatIranianIraqiIrishIroquoisIsraeliItalianJamaicanJapaneseJordanianKenyanKiowaKoreanLaotianLatvianLebaneseLiberianLithuanianLumbeeLuxembourgerMacedonianMalaysianMalteseMarshalleseMenomineeMexicanMexican American IndianMongolianMoroccanNative HawaiianNavajoNepaleseNew ZealanderNicaraguanNigerianNorthern EuropeanNorwegianOkinawanOsageOttawaPaiutePakistaniPalestinianPanamanianParaguayanPennsylvania GermanPeruvianPimaPolishPortuguesePotawatomiPuebloPuerto RicanPuget Sound SalishRomanianRussianSalvadoranSamoanScandinavianScotch-IrishScottishSeminoleSenegaleseSerbianShoshoneSierra LeoneanSiouxSlavicSlovakSloveneSomaliSouth AfricanSouth AmericanSouth American IndianSpaniardSpanishSpanish AmericanSpanish American IndianSri LankanSubsaharan AfricanSudaneseSwedishSwissSyrianTaiwaneseThaiTlingit-HaidaTohono O'OdhamTonganTrinidadian and TobagonianTsimshianTurkishU.S. Virgin IslanderUgandanUkrainianUruguayanUteVenezuelanVietnameseWelshWest IndianYakamaYaquiYugoslavianYumanYup'ikZimbabwean
Immigration
NonimmigrantsImmigrantsAfghanistanAfricaAlbaniaArgentinaArmeniaAsiaAustraliaAustriaBahamasBangladeshBarbadosBelarusBelgiumBelizeBoliviaBosnia and HerzegovinaBrazilBulgariaBurma/MyanmarCabo VerdeCambodiaCameroonCanadaCaribbeanCentral AmericaChileChinaColombiaCongoCosta RicaCroatiaCubaCzechoslovakiaDenmarkDominicaDominican RepublicEastern AfricaEastern AsiaEastern EuropeEcuadorEgyptEl SalvadorEnglandEritreaEthiopiaEuropeFijiFranceGermanyGhanaGreeceGrenadaGuatemalaGuyanaHaitiHondurasHong KongHungaryIndiaIndonesiaIranIraqIrelandIsraelItalyJamaicaJapanJordanKazakhstanKenyaKoreaKuwaitLaosLatin AmericaLatviaLebanonLiberiaLithuaniaMalaysiaMexicoMicronesiaMiddle AfricaMoldovaMoroccoNepalNetherlandsNicaraguaNigeriaNorth AmericaNorth MacedoniaNorthern AfricaNorthern EuropeNorwayOceaniaPakistanPanamaPeruPhilippinesPolandPortugalRomaniaRussiaSaudi ArabiaScotlandSenegalSerbiaSierra LeoneSingaporeSomaliaSouth AfricaSouth AmericaSouth Central AsiaSouth Eastern AsiaSouthern EuropeSpainSri LankaSt. Vincent and the GrenadinesSudanSwedenSwitzerlandSyriaTaiwanThailandTrinidad and TobagoTurkeyUgandaUkraineUruguayUzbekistanVenezuelaVietnamWest IndiesWestern AfricaWestern AsiaWestern EuropeYemenZaireZimbabweAzores
Soviet Union
Race
Ancestry
AfghanAfricanAlaska NativeAlaskan AthabascanAlbanianAleutAlsatianAmericanApacheArabArapahoArgentineanArmenianAssyrian/Chaldean/SyriacAustralianAustrianBahamianBangladeshiBarbadianBasqueBelgianBelizeanBermudanBhutaneseBlackfeetBolivianBrazilianBritishBritish West IndianBulgarianBurmeseCajunCambodianCanadianCape VerdeanCarpatho RusynCelticCentral AmericanCentral American IndianCherokeeCheyenneChickasawChileanChineseChippewaChoctawColombianColvilleComancheCosta RicanCreeCreekCroatianCrowCubanCypriotCzechCzechoslovakianDanishDelawareDominicanDutchDutch West IndianEastern EuropeanEcuadorianEgyptianEnglishEstonianEthiopianEuropeanFijianFilipinoFinnishFrenchFrench American IndianFrench CanadianGermanGerman RussianGhanaianGreekGuamanian/ChamorroGuatemalanGuyaneseHaitianHmongHonduranHopiHoumaHungarianIcelanderIndian (Asian)IndonesianInupiatIranianIraqiIrishIroquoisIsraeliItalianJamaicanJapaneseJordanianKenyanKiowaKoreanLaotianLatvianLebaneseLiberianLithuanianLumbeeLuxembourgerMacedonianMalaysianMalteseMarshalleseMenomineeMexicanMexican American IndianMongolianMoroccanNative HawaiianNavajoNepaleseNew ZealanderNicaraguanNigerianNorthern EuropeanNorwegianOkinawanOsageOttawaPaiutePakistaniPalestinianPanamanianParaguayanPennsylvania GermanPeruvianPimaPolishPortuguesePotawatomiPuebloPuerto RicanPuget Sound SalishRomanianRussianSalvadoranSamoanScandinavianScotch-IrishScottishSeminoleSenegaleseSerbianShoshoneSierra LeoneanSiouxSlavicSlovakSloveneSomaliSouth AfricanSouth AmericanSouth American IndianSoviet UnionSpaniardSpanishSpanish AmericanSpanish American IndianSri LankanSubsaharan AfricanSudaneseSwedishSwissSyrianTaiwaneseThaiTlingit-HaidaTohono O'OdhamTonganTrinidadian and TobagonianTsimshianTurkishU.S. Virgin IslanderUgandanUkrainianUruguayanUteVenezuelanVietnameseWelshWest IndianYakamaYaquiYugoslavianYumanYup'ikZimbabwean
Immigration
NonimmigrantsImmigrantsAfghanistanAfricaAlbaniaArgentinaArmeniaAsiaAustraliaAustriaBahamasBangladeshBarbadosBelarusBelgiumBelizeBoliviaBosnia and HerzegovinaBrazilBulgariaBurma/MyanmarCabo VerdeCambodiaCameroonCanadaCaribbeanCentral AmericaChileChinaColombiaCongoCosta RicaCroatiaCubaCzechoslovakiaDenmarkDominicaDominican RepublicEastern AfricaEastern AsiaEastern EuropeEcuadorEgyptEl SalvadorEnglandEritreaEthiopiaEuropeFijiFranceGermanyGhanaGreeceGrenadaGuatemalaHaitiHondurasHong KongHungaryIndiaIndonesiaIranIraqIrelandIsraelItalyJamaicaJapanJordanKazakhstanKenyaKoreaKuwaitLaosLatin AmericaLatviaLebanonLiberiaLithuaniaMalaysiaMexicoMicronesiaMiddle AfricaMoldovaMoroccoNepalNetherlandsNicaraguaNigeriaNorth AmericaNorth MacedoniaNorthern AfricaNorthern EuropeNorwayOceaniaPakistanPanamaPeruPhilippinesPolandPortugalRomaniaRussiaSaudi ArabiaScotlandSenegalSerbiaSierra LeoneSingaporeSomaliaSouth AfricaSouth AmericaSouth Central AsiaSouth Eastern AsiaSouthern EuropeSpainSri LankaSt. Vincent and the GrenadinesSudanSwedenSwitzerlandSyriaTaiwanThailandTrinidad and TobagoTurkeyUgandaUkraineUruguayUzbekistanVenezuelaVietnamWest IndiesWestern AfricaWestern AsiaWestern EuropeYemenZaireZimbabweAzores
Poverty
Income
Poverty
Unemployment
Labor Participation
Family Structure
Vehicle Availability
Education Level
Disability

Poverty Comparison

Immigrants from Guyana

Soviet Union

Tragic
Excellent
14.5%
POVERTY
0.1/ 100
METRIC RATING
265th/ 347
METRIC RANK
11.7%
POVERTY
88.4/ 100
METRIC RATING
124th/ 347
METRIC RANK

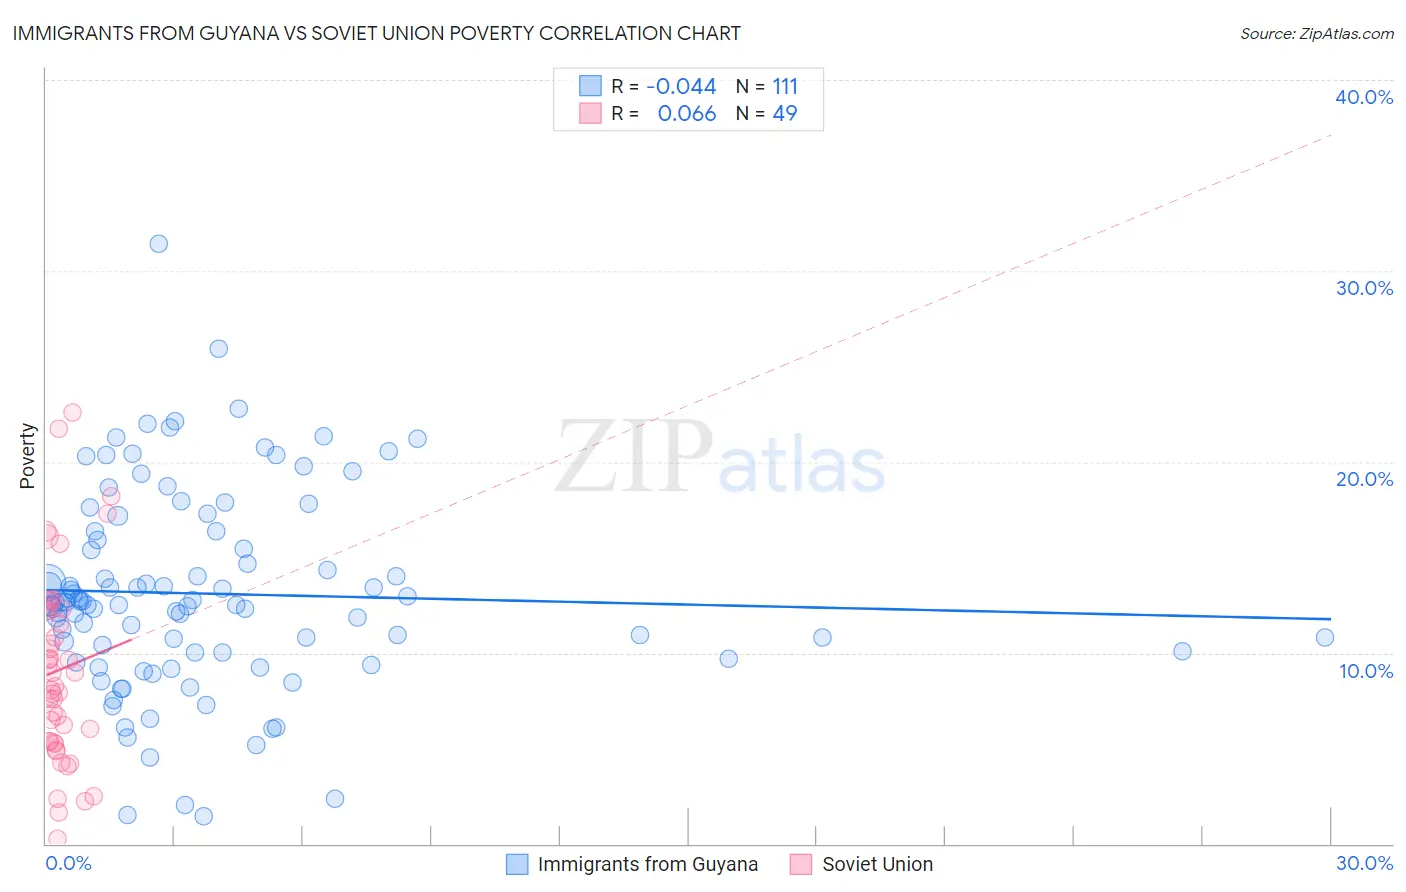
Immigrants from Guyana vs Soviet Union Poverty Correlation Chart

The statistical analysis conducted on geographies consisting of 183,648,527 people shows no correlation between the proportion of Immigrants from Guyana and poverty level in the United States with a correlation coefficient (R) of -0.044 and weighted average of 14.5%. Similarly, the statistical analysis conducted on geographies consisting of 43,449,399 people shows a slight positive correlation between the proportion of Soviet Union and poverty level in the United States with a correlation coefficient (R) of 0.066 and weighted average of 11.7%, a difference of 23.4%.
Immigrants from Guyana vs Soviet Union Poverty

Poverty Correlation Summary

MeasurementImmigrants from GuyanaSoviet Union
Minimum1.4%0.29%
Maximum31.4%22.6%
Range30.0%22.3%
Mean13.1%9.1%
Median12.6%8.3%
Interquartile 25% (IQ1)10.0%5.3%
Interquartile 75% (IQ3)16.4%12.3%
Interquartile Range (IQR)6.4%6.9%
Standard Deviation (Sample)5.3%5.0%
Standard Deviation (Population)5.2%5.0%

Similar Demographics by Poverty

Demographics Similar to Immigrants from Guyana by Poverty

In terms of poverty, the demographic groups most similar to Immigrants from Guyana are Immigrants from Jamaica (14.4%, a difference of 0.13%), Guyanese (14.5%, a difference of 0.17%), Jamaican (14.4%, a difference of 0.21%), Iroquois (14.5%, a difference of 0.49%), and Subsaharan African (14.5%, a difference of 0.52%).
DemographicsRating | RankPoverty
Ottawa
0.1
/100
|
#258
Tragic
14.3%
Immigrants | Nicaragua
0.1
/100
|
#259
Tragic
14.3%
Cape Verdeans
0.1
/100
|
#260
Tragic
14.4%
Cherokee
0.1
/100
|
#261
Tragic
14.4%
Immigrants | Liberia
0.1
/100
|
#262
Tragic
14.4%
Jamaicans
0.1
/100
|
#263
Tragic
14.4%
Immigrants | Jamaica
0.1
/100
|
#264
Tragic
14.4%
Immigrants | Guyana
0.1
/100
|
#265
Tragic
14.5%
Guyanese
0.1
/100
|
#266
Tragic
14.5%
Iroquois
0.1
/100
|
#267
Tragic
14.5%
Sub-Saharan Africans
0.1
/100
|
#268
Tragic
14.5%
Immigrants | Cuba
0.1
/100
|
#269
Tragic
14.6%
Central Americans
0.1
/100
|
#270
Tragic
14.6%
Shoshone
0.0
/100
|
#271
Tragic
14.7%
Chickasaw
0.0
/100
|
#272
Tragic
14.7%

Demographics Similar to Soviet Union by Poverty

In terms of poverty, the demographic groups most similar to Soviet Union are Immigrants from Brazil (11.7%, a difference of 0.040%), Immigrants from Hungary (11.7%, a difference of 0.070%), Immigrants from Norway (11.7%, a difference of 0.080%), New Zealander (11.7%, a difference of 0.090%), and Puget Sound Salish (11.7%, a difference of 0.090%).
DemographicsRating | RankPoverty
Sri Lankans
89.4
/100
|
#117
Excellent
11.7%
Argentineans
89.1
/100
|
#118
Excellent
11.7%
Tlingit-Haida
89.0
/100
|
#119
Excellent
11.7%
Immigrants | South Eastern Asia
88.9
/100
|
#120
Excellent
11.7%
New Zealanders
88.7
/100
|
#121
Excellent
11.7%
Puget Sound Salish
88.7
/100
|
#122
Excellent
11.7%
Immigrants | Hungary
88.6
/100
|
#123
Excellent
11.7%
Soviet Union
88.4
/100
|
#124
Excellent
11.7%
Immigrants | Brazil
88.2
/100
|
#125
Excellent
11.7%
Immigrants | Norway
88.0
/100
|
#126
Excellent
11.7%
Immigrants | Argentina
88.0
/100
|
#127
Excellent
11.7%
Immigrants | Israel
87.4
/100
|
#128
Excellent
11.7%
South Africans
87.0
/100
|
#129
Excellent
11.7%
Immigrants | Ukraine
86.6
/100
|
#130
Excellent
11.8%
French
86.1
/100
|
#131
Excellent
11.8%