Immigrants from Guyana vs Liberian Seniors Poverty Over the Age of 75
COMPARE
Immigrants from Guyana
Liberian
Seniors Poverty Over the Age of 75
Seniors Poverty Over the Age of 75 Comparison
Immigrants from Guyana
Liberians
16.2%
SENIORS POVERTY OVER THE AGE OF 75
0.0/ 100
METRIC RATING
317th/ 347
METRIC RANK
12.5%
SENIORS POVERTY OVER THE AGE OF 75
23.2/ 100
METRIC RATING
191st/ 347
METRIC RANK
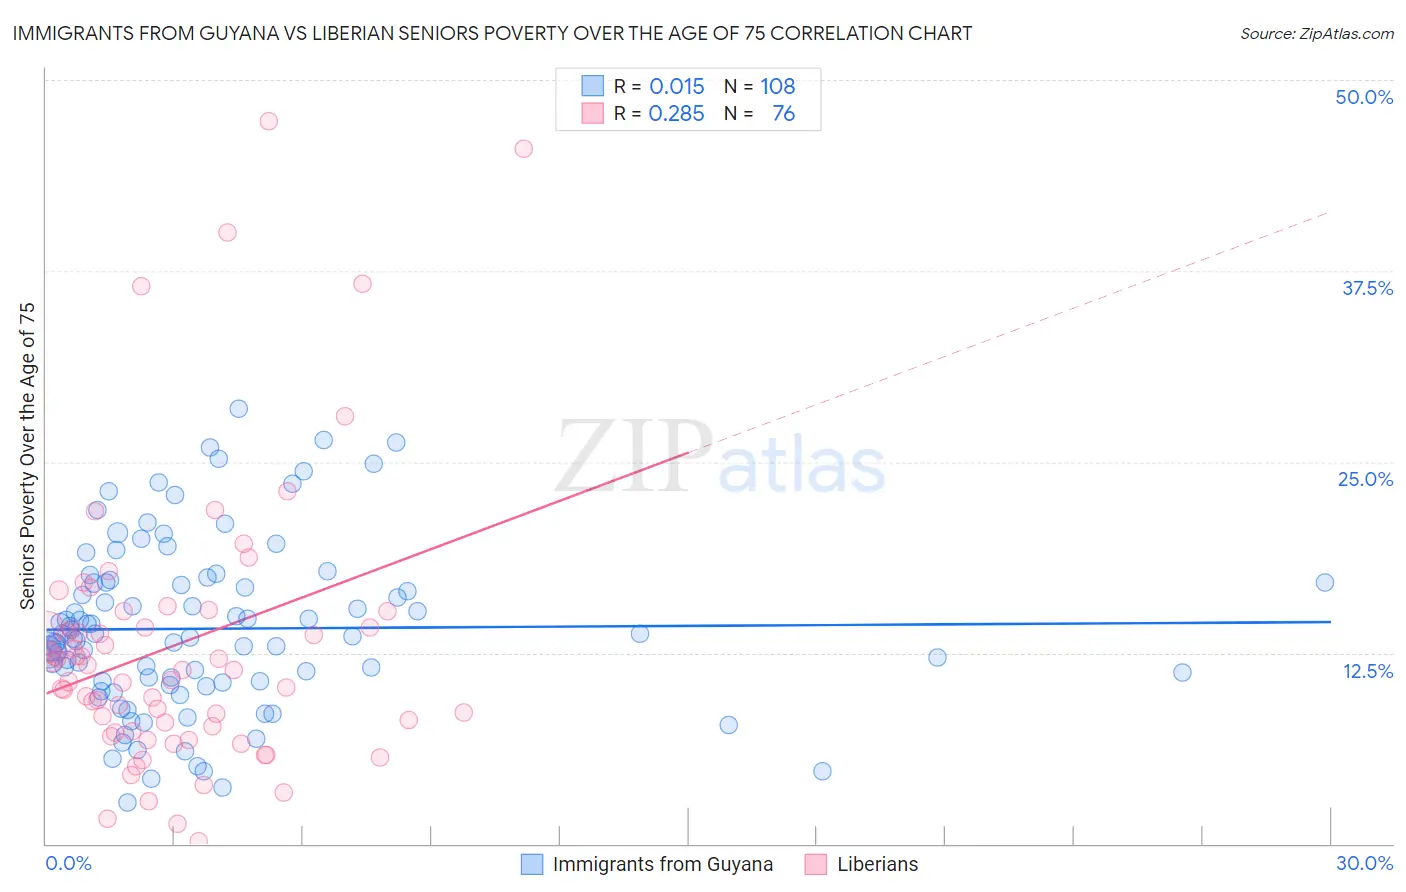
Immigrants from Guyana vs Liberian Seniors Poverty Over the Age of 75 Correlation Chart
The statistical analysis conducted on geographies consisting of 182,494,959 people shows no correlation between the proportion of Immigrants from Guyana and poverty level among seniors over the age of 75 in the United States with a correlation coefficient (R) of 0.015 and weighted average of 16.2%. Similarly, the statistical analysis conducted on geographies consisting of 117,599,519 people shows a weak positive correlation between the proportion of Liberians and poverty level among seniors over the age of 75 in the United States with a correlation coefficient (R) of 0.285 and weighted average of 12.5%, a difference of 29.9%.
Seniors Poverty Over the Age of 75 Correlation Summary
| Measurement | Immigrants from Guyana | Liberian |
| Minimum | 2.7% | 0.12% |
| Maximum | 28.5% | 47.3% |
| Range | 25.8% | 47.2% |
| Mean | 14.1% | 13.0% |
| Median | 13.6% | 11.4% |
| Interquartile 25% (IQ1) | 10.6% | 7.5% |
| Interquartile 75% (IQ3) | 17.1% | 14.7% |
| Interquartile Range (IQR) | 6.5% | 7.2% |
| Standard Deviation (Sample) | 5.6% | 9.2% |
| Standard Deviation (Population) | 5.5% | 9.1% |
Similar Demographics by Seniors Poverty Over the Age of 75
Demographics Similar to Immigrants from Guyana by Seniors Poverty Over the Age of 75
In terms of seniors poverty over the age of 75, the demographic groups most similar to Immigrants from Guyana are Houma (16.2%, a difference of 0.13%), Haitian (16.2%, a difference of 0.17%), Immigrants from Ecuador (16.1%, a difference of 0.61%), Guyanese (16.1%, a difference of 0.62%), and Tsimshian (16.1%, a difference of 0.93%).
| Demographics | Rating | Rank | Seniors Poverty Over the Age of 75 |
| Vietnamese | 0.0 /100 | #310 | Tragic 15.9% |
| Trinidadians and Tobagonians | 0.0 /100 | #311 | Tragic 15.9% |
| Crow | 0.0 /100 | #312 | Tragic 15.9% |
| Barbadians | 0.0 /100 | #313 | Tragic 16.0% |
| Tsimshian | 0.0 /100 | #314 | Tragic 16.1% |
| Guyanese | 0.0 /100 | #315 | Tragic 16.1% |
| Immigrants | Ecuador | 0.0 /100 | #316 | Tragic 16.1% |
| Immigrants | Guyana | 0.0 /100 | #317 | Tragic 16.2% |
| Houma | 0.0 /100 | #318 | Tragic 16.2% |
| Haitians | 0.0 /100 | #319 | Tragic 16.2% |
| Immigrants | Yemen | 0.0 /100 | #320 | Tragic 16.5% |
| Immigrants | Haiti | 0.0 /100 | #321 | Tragic 16.5% |
| Immigrants | Barbados | 0.0 /100 | #322 | Tragic 16.5% |
| Central American Indians | 0.0 /100 | #323 | Tragic 16.5% |
| Immigrants | Uzbekistan | 0.0 /100 | #324 | Tragic 16.5% |
Demographics Similar to Liberians by Seniors Poverty Over the Age of 75
In terms of seniors poverty over the age of 75, the demographic groups most similar to Liberians are Immigrants from Congo (12.5%, a difference of 0.070%), Immigrants from Indonesia (12.5%, a difference of 0.13%), Immigrants from Northern Africa (12.5%, a difference of 0.22%), Yaqui (12.5%, a difference of 0.29%), and Choctaw (12.5%, a difference of 0.35%).
| Demographics | Rating | Rank | Seniors Poverty Over the Age of 75 |
| Kiowa | 36.0 /100 | #184 | Fair 12.3% |
| Immigrants | Malaysia | 35.8 /100 | #185 | Fair 12.3% |
| Sri Lankans | 32.3 /100 | #186 | Fair 12.4% |
| Yaqui | 25.9 /100 | #187 | Fair 12.5% |
| Immigrants | Northern Africa | 25.2 /100 | #188 | Fair 12.5% |
| Immigrants | Indonesia | 24.4 /100 | #189 | Fair 12.5% |
| Immigrants | Congo | 23.9 /100 | #190 | Fair 12.5% |
| Liberians | 23.2 /100 | #191 | Fair 12.5% |
| Choctaw | 20.2 /100 | #192 | Fair 12.5% |
| Taiwanese | 17.8 /100 | #193 | Poor 12.6% |
| Alsatians | 17.7 /100 | #194 | Poor 12.6% |
| Immigrants | France | 17.4 /100 | #195 | Poor 12.6% |
| Immigrants | Eastern Europe | 16.0 /100 | #196 | Poor 12.6% |
| Nepalese | 14.4 /100 | #197 | Poor 12.6% |
| Chileans | 13.7 /100 | #198 | Poor 12.6% |