Immigrants from Guyana vs Cheyenne Child Poverty Under the Age of 16

COMPARE

Immigrants from Guyana
Race
Ancestry
AfghanAfricanAlaska NativeAlaskan AthabascanAlbanianAleutAlsatianAmericanApacheArabArapahoArgentineanArmenianAssyrian/Chaldean/SyriacAustralianAustrianBahamianBangladeshiBarbadianBasqueBelgianBelizeanBermudanBhutaneseBlackfeetBolivianBrazilianBritishBritish West IndianBulgarianBurmeseCajunCambodianCanadianCape VerdeanCarpatho RusynCelticCentral AmericanCentral American IndianCherokeeChickasawChileanChineseChippewaChoctawColombianColvilleComancheCosta RicanCreeCreekCroatianCrowCubanCypriotCzechCzechoslovakianDanishDelawareDominicanDutchDutch West IndianEastern EuropeanEcuadorianEgyptianEnglishEstonianEthiopianEuropeanFijianFilipinoFinnishFrenchFrench American IndianFrench CanadianGermanGerman RussianGhanaianGreekGuamanian/ChamorroGuatemalanGuyaneseHaitianHmongHonduranHopiHoumaHungarianIcelanderIndian (Asian)IndonesianInupiatIranianIraqiIrishIroquoisIsraeliItalianJamaicanJapaneseJordanianKenyanKiowaKoreanLaotianLatvianLebaneseLiberianLithuanianLumbeeLuxembourgerMacedonianMalaysianMalteseMarshalleseMenomineeMexicanMexican American IndianMongolianMoroccanNative HawaiianNavajoNepaleseNew ZealanderNicaraguanNigerianNorthern EuropeanNorwegianOkinawanOsageOttawaPaiutePakistaniPalestinianPanamanianParaguayanPennsylvania GermanPeruvianPimaPolishPortuguesePotawatomiPuebloPuerto RicanPuget Sound SalishRomanianRussianSalvadoranSamoanScandinavianScotch-IrishScottishSeminoleSenegaleseSerbianShoshoneSierra LeoneanSiouxSlavicSlovakSloveneSomaliSouth AfricanSouth AmericanSouth American IndianSoviet UnionSpaniardSpanishSpanish AmericanSpanish American IndianSri LankanSubsaharan AfricanSudaneseSwedishSwissSyrianTaiwaneseThaiTlingit-HaidaTohono O'OdhamTonganTrinidadian and TobagonianTsimshianTurkishU.S. Virgin IslanderUgandanUkrainianUruguayanUteVenezuelanVietnameseWelshWest IndianYakamaYaquiYugoslavianYumanYup'ikZimbabwean
Immigration
NonimmigrantsImmigrantsAfghanistanAfricaAlbaniaArgentinaArmeniaAsiaAustraliaAustriaBahamasBangladeshBarbadosBelarusBelgiumBelizeBoliviaBosnia and HerzegovinaBrazilBulgariaBurma/MyanmarCabo VerdeCambodiaCameroonCanadaCaribbeanCentral AmericaChileChinaColombiaCongoCosta RicaCroatiaCubaCzechoslovakiaDenmarkDominicaDominican RepublicEastern AfricaEastern AsiaEastern EuropeEcuadorEgyptEl SalvadorEnglandEritreaEthiopiaEuropeFijiFranceGermanyGhanaGreeceGrenadaGuatemalaGuyanaHaitiHondurasHong KongHungaryIndiaIndonesiaIranIraqIrelandIsraelItalyJamaicaJapanJordanKazakhstanKenyaKoreaKuwaitLaosLatin AmericaLatviaLebanonLiberiaLithuaniaMalaysiaMexicoMicronesiaMiddle AfricaMoldovaMoroccoNepalNetherlandsNicaraguaNigeriaNorth AmericaNorth MacedoniaNorthern AfricaNorthern EuropeNorwayOceaniaPakistanPanamaPeruPhilippinesPolandPortugalRomaniaRussiaSaudi ArabiaScotlandSenegalSerbiaSierra LeoneSingaporeSomaliaSouth AfricaSouth AmericaSouth Central AsiaSouth Eastern AsiaSouthern EuropeSpainSri LankaSt. Vincent and the GrenadinesSudanSwedenSwitzerlandSyriaTaiwanThailandTrinidad and TobagoTurkeyUgandaUkraineUruguayUzbekistanVenezuelaVietnamWest IndiesWestern AfricaWestern AsiaWestern EuropeYemenZaireZimbabweAzores
Cheyenne
Race
Ancestry
AfghanAfricanAlaska NativeAlaskan AthabascanAlbanianAleutAlsatianAmericanApacheArabArapahoArgentineanArmenianAssyrian/Chaldean/SyriacAustralianAustrianBahamianBangladeshiBarbadianBasqueBelgianBelizeanBermudanBhutaneseBlackfeetBolivianBrazilianBritishBritish West IndianBulgarianBurmeseCajunCambodianCanadianCape VerdeanCarpatho RusynCelticCentral AmericanCentral American IndianCherokeeCheyenneChickasawChileanChineseChippewaChoctawColombianColvilleComancheCosta RicanCreeCreekCroatianCrowCubanCypriotCzechCzechoslovakianDanishDelawareDominicanDutchDutch West IndianEastern EuropeanEcuadorianEgyptianEnglishEstonianEthiopianEuropeanFijianFilipinoFinnishFrenchFrench American IndianFrench CanadianGermanGerman RussianGhanaianGreekGuamanian/ChamorroGuatemalanGuyaneseHaitianHmongHonduranHopiHoumaHungarianIcelanderIndian (Asian)IndonesianInupiatIranianIraqiIrishIroquoisIsraeliItalianJamaicanJapaneseJordanianKenyanKiowaKoreanLaotianLatvianLebaneseLiberianLithuanianLumbeeLuxembourgerMacedonianMalaysianMalteseMarshalleseMenomineeMexicanMexican American IndianMongolianMoroccanNative HawaiianNavajoNepaleseNew ZealanderNicaraguanNigerianNorthern EuropeanNorwegianOkinawanOsageOttawaPaiutePakistaniPalestinianPanamanianParaguayanPennsylvania GermanPeruvianPimaPolishPortuguesePotawatomiPuebloPuerto RicanPuget Sound SalishRomanianRussianSalvadoranSamoanScandinavianScotch-IrishScottishSeminoleSenegaleseSerbianShoshoneSierra LeoneanSiouxSlavicSlovakSloveneSomaliSouth AfricanSouth AmericanSouth American IndianSoviet UnionSpaniardSpanishSpanish AmericanSpanish American IndianSri LankanSubsaharan AfricanSudaneseSwedishSwissSyrianTaiwaneseThaiTlingit-HaidaTohono O'OdhamTonganTrinidadian and TobagonianTsimshianTurkishU.S. Virgin IslanderUgandanUkrainianUruguayanUteVenezuelanVietnameseWelshWest IndianYakamaYaquiYugoslavianYumanYup'ikZimbabwean
Immigration
NonimmigrantsImmigrantsAfghanistanAfricaAlbaniaArgentinaArmeniaAsiaAustraliaAustriaBahamasBangladeshBarbadosBelarusBelgiumBelizeBoliviaBosnia and HerzegovinaBrazilBulgariaBurma/MyanmarCabo VerdeCambodiaCameroonCanadaCaribbeanCentral AmericaChileChinaColombiaCongoCosta RicaCroatiaCubaCzechoslovakiaDenmarkDominicaDominican RepublicEastern AfricaEastern AsiaEastern EuropeEcuadorEgyptEl SalvadorEnglandEritreaEthiopiaEuropeFijiFranceGermanyGhanaGreeceGrenadaGuatemalaHaitiHondurasHong KongHungaryIndiaIndonesiaIranIraqIrelandIsraelItalyJamaicaJapanJordanKazakhstanKenyaKoreaKuwaitLaosLatin AmericaLatviaLebanonLiberiaLithuaniaMalaysiaMexicoMicronesiaMiddle AfricaMoldovaMoroccoNepalNetherlandsNicaraguaNigeriaNorth AmericaNorth MacedoniaNorthern AfricaNorthern EuropeNorwayOceaniaPakistanPanamaPeruPhilippinesPolandPortugalRomaniaRussiaSaudi ArabiaScotlandSenegalSerbiaSierra LeoneSingaporeSomaliaSouth AfricaSouth AmericaSouth Central AsiaSouth Eastern AsiaSouthern EuropeSpainSri LankaSt. Vincent and the GrenadinesSudanSwedenSwitzerlandSyriaTaiwanThailandTrinidad and TobagoTurkeyUgandaUkraineUruguayUzbekistanVenezuelaVietnamWest IndiesWestern AfricaWestern AsiaWestern EuropeYemenZaireZimbabweAzores
Child Poverty Under the Age of 16
Income
Poverty
Unemployment
Labor Participation
Family Structure
Vehicle Availability
Education Level
Disability

Child Poverty Under the Age of 16 Comparison

Immigrants from Guyana

Cheyenne

Tragic
Tragic
19.4%
CHILD POVERTY UNDER THE AGE OF 16
0.1/ 100
METRIC RATING
262nd/ 347
METRIC RANK
25.4%
CHILD POVERTY UNDER THE AGE OF 16
0.0/ 100
METRIC RATING
338th/ 347
METRIC RANK

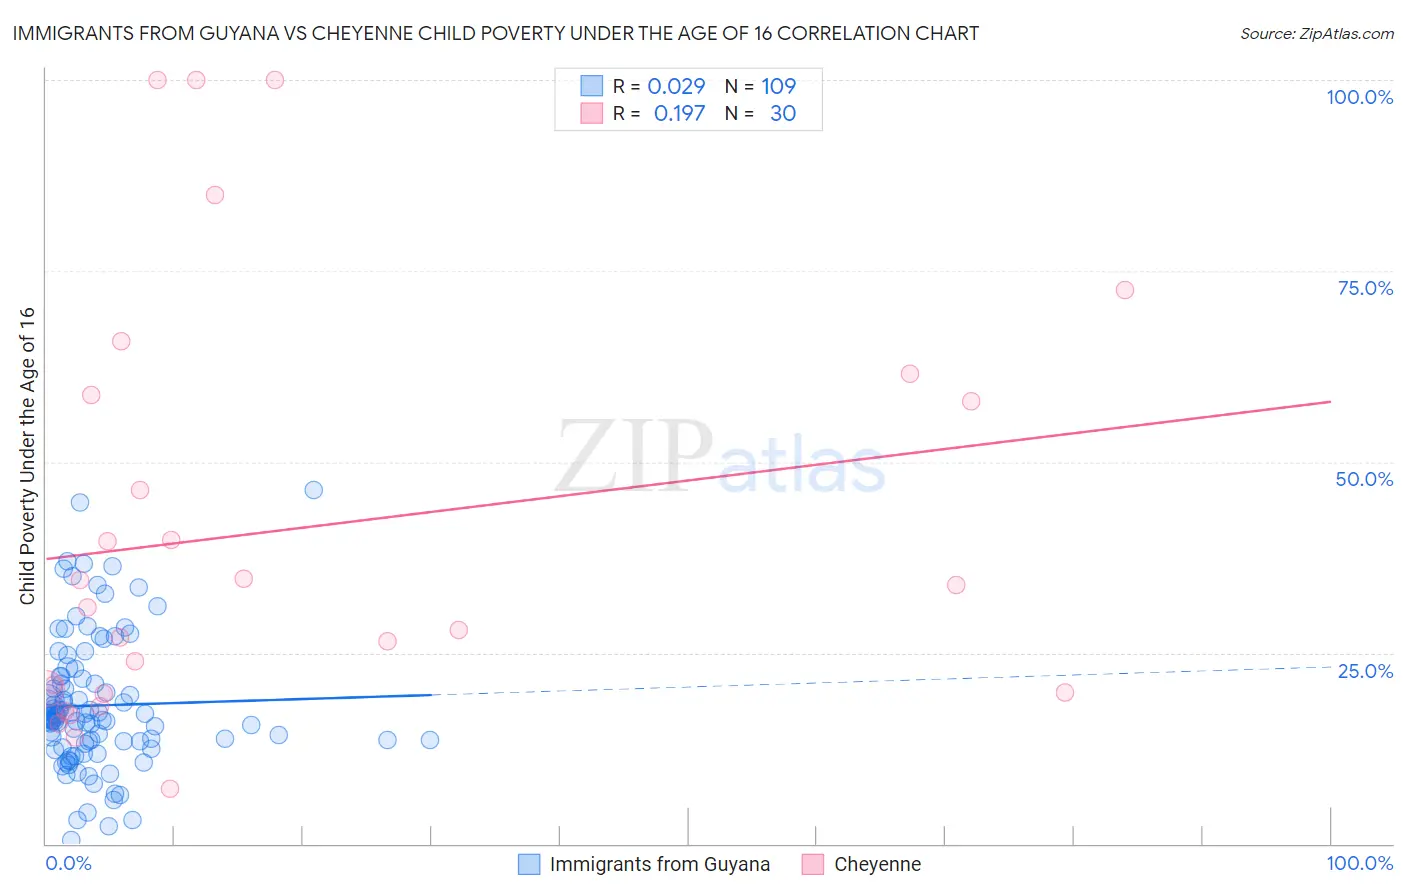
Immigrants from Guyana vs Cheyenne Child Poverty Under the Age of 16 Correlation Chart

The statistical analysis conducted on geographies consisting of 182,901,367 people shows no correlation between the proportion of Immigrants from Guyana and poverty level among children under the age of 16 in the United States with a correlation coefficient (R) of 0.029 and weighted average of 19.4%. Similarly, the statistical analysis conducted on geographies consisting of 80,519,978 people shows a poor positive correlation between the proportion of Cheyenne and poverty level among children under the age of 16 in the United States with a correlation coefficient (R) of 0.197 and weighted average of 25.4%, a difference of 31.0%.
Immigrants from Guyana vs Cheyenne Child Poverty Under the Age of 16

Child Poverty Under the Age of 16 Correlation Summary

MeasurementImmigrants from GuyanaCheyenne
Minimum0.46%7.1%
Maximum46.4%100.0%
Range45.9%92.9%
Mean18.1%41.2%
Median16.5%32.4%
Interquartile 25% (IQ1)13.3%19.9%
Interquartile 75% (IQ3)21.7%58.8%
Interquartile Range (IQR)8.5%38.9%
Standard Deviation (Sample)8.7%27.6%
Standard Deviation (Population)8.6%27.1%

Similar Demographics by Child Poverty Under the Age of 16

Demographics Similar to Immigrants from Guyana by Child Poverty Under the Age of 16

In terms of child poverty under the age of 16, the demographic groups most similar to Immigrants from Guyana are Immigrants from Burma/Myanmar (19.4%, a difference of 0.040%), Guyanese (19.3%, a difference of 0.12%), Mexican American Indian (19.3%, a difference of 0.22%), Vietnamese (19.4%, a difference of 0.32%), and Immigrants from Ecuador (19.4%, a difference of 0.38%).
DemographicsRating | RankChild Poverty Under the Age of 16
Trinidadians and Tobagonians
0.2
/100
|
#255
Tragic
19.2%
Inupiat
0.2
/100
|
#256
Tragic
19.2%
Ottawa
0.2
/100
|
#257
Tragic
19.2%
Spanish Americans
0.2
/100
|
#258
Tragic
19.2%
Mexican American Indians
0.2
/100
|
#259
Tragic
19.3%
Guyanese
0.2
/100
|
#260
Tragic
19.3%
Immigrants | Burma/Myanmar
0.1
/100
|
#261
Tragic
19.4%
Immigrants | Guyana
0.1
/100
|
#262
Tragic
19.4%
Vietnamese
0.1
/100
|
#263
Tragic
19.4%
Immigrants | Ecuador
0.1
/100
|
#264
Tragic
19.4%
Chickasaw
0.1
/100
|
#265
Tragic
19.5%
Liberians
0.1
/100
|
#266
Tragic
19.5%
Cherokee
0.1
/100
|
#267
Tragic
19.5%
Jamaicans
0.1
/100
|
#268
Tragic
19.7%
Immigrants | El Salvador
0.1
/100
|
#269
Tragic
19.7%

Demographics Similar to Cheyenne by Child Poverty Under the Age of 16

In terms of child poverty under the age of 16, the demographic groups most similar to Cheyenne are Sioux (25.2%, a difference of 0.63%), Yup'ik (25.1%, a difference of 1.0%), Houma (24.9%, a difference of 2.1%), Crow (26.0%, a difference of 2.3%), and Black/African American (24.4%, a difference of 3.8%).
DemographicsRating | RankChild Poverty Under the Age of 16
Apache
0.0
/100
|
#331
Tragic
23.8%
Pueblo
0.0
/100
|
#332
Tragic
23.9%
Immigrants | Dominican Republic
0.0
/100
|
#333
Tragic
24.0%
Blacks/African Americans
0.0
/100
|
#334
Tragic
24.4%
Houma
0.0
/100
|
#335
Tragic
24.9%
Yup'ik
0.0
/100
|
#336
Tragic
25.1%
Sioux
0.0
/100
|
#337
Tragic
25.2%
Cheyenne
0.0
/100
|
#338
Tragic
25.4%
Crow
0.0
/100
|
#339
Tragic
26.0%
Hopi
0.0
/100
|
#340
Tragic
27.1%
Yuman
0.0
/100
|
#341
Tragic
28.9%
Pima
0.0
/100
|
#342
Tragic
29.0%
Immigrants | Yemen
0.0
/100
|
#343
Tragic
29.1%
Navajo
0.0
/100
|
#344
Tragic
30.2%
Lumbee
0.0
/100
|
#345
Tragic
31.0%