Immigrants from Guatemala vs Immigrants from West Indies Single Mother Poverty
COMPARE
Immigrants from Guatemala
Immigrants from West Indies
Single Mother Poverty
Single Mother Poverty Comparison
Immigrants from Guatemala
Immigrants from West Indies
33.3%
SINGLE MOTHER POVERTY
0.0/ 100
METRIC RATING
299th/ 347
METRIC RANK
31.1%
SINGLE MOTHER POVERTY
0.4/ 100
METRIC RATING
256th/ 347
METRIC RANK
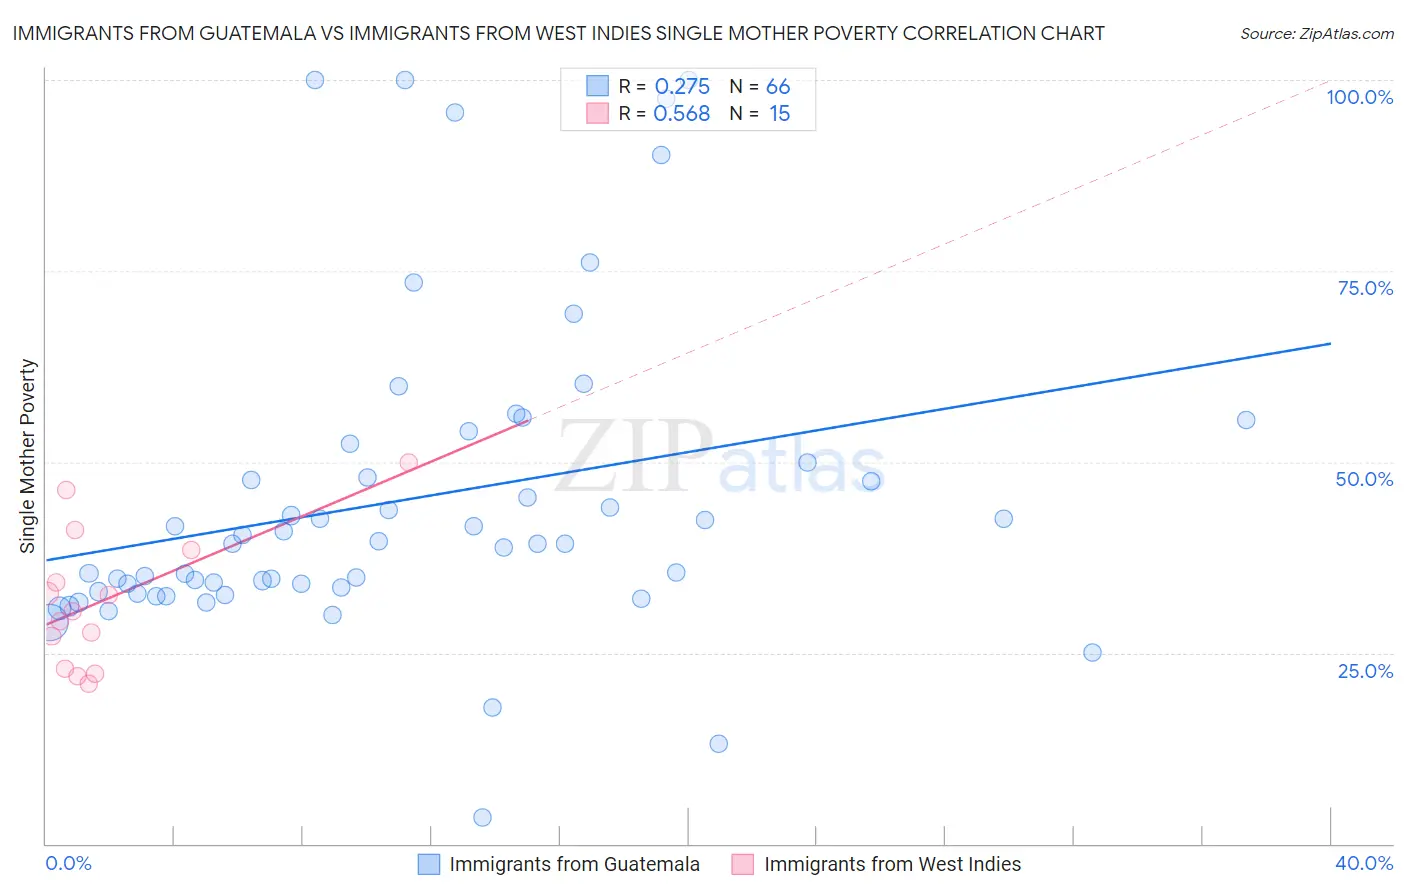
Immigrants from Guatemala vs Immigrants from West Indies Single Mother Poverty Correlation Chart
The statistical analysis conducted on geographies consisting of 371,171,029 people shows a weak positive correlation between the proportion of Immigrants from Guatemala and poverty level among single mothers in the United States with a correlation coefficient (R) of 0.275 and weighted average of 33.3%. Similarly, the statistical analysis conducted on geographies consisting of 72,200,538 people shows a substantial positive correlation between the proportion of Immigrants from West Indies and poverty level among single mothers in the United States with a correlation coefficient (R) of 0.568 and weighted average of 31.1%, a difference of 7.1%.
Single Mother Poverty Correlation Summary
| Measurement | Immigrants from Guatemala | Immigrants from West Indies |
| Minimum | 3.4% | 21.0% |
| Maximum | 100.0% | 50.0% |
| Range | 96.6% | 29.0% |
| Mean | 45.0% | 31.9% |
| Median | 39.3% | 30.5% |
| Interquartile 25% (IQ1) | 33.0% | 22.9% |
| Interquartile 75% (IQ3) | 50.0% | 38.5% |
| Interquartile Range (IQR) | 17.0% | 15.5% |
| Standard Deviation (Sample) | 20.7% | 8.9% |
| Standard Deviation (Population) | 20.5% | 8.6% |
Similar Demographics by Single Mother Poverty
Demographics Similar to Immigrants from Guatemala by Single Mother Poverty
In terms of single mother poverty, the demographic groups most similar to Immigrants from Guatemala are Hispanic or Latino (33.3%, a difference of 0.0%), African (33.3%, a difference of 0.090%), Pennsylvania German (33.2%, a difference of 0.20%), Immigrants from Somalia (33.4%, a difference of 0.25%), and Blackfeet (33.2%, a difference of 0.34%).
| Demographics | Rating | Rank | Single Mother Poverty |
| Shoshone | 0.0 /100 | #292 | Tragic 32.9% |
| Aleuts | 0.0 /100 | #293 | Tragic 32.9% |
| French American Indians | 0.0 /100 | #294 | Tragic 33.1% |
| Yaqui | 0.0 /100 | #295 | Tragic 33.1% |
| Blackfeet | 0.0 /100 | #296 | Tragic 33.2% |
| Pennsylvania Germans | 0.0 /100 | #297 | Tragic 33.2% |
| Africans | 0.0 /100 | #298 | Tragic 33.3% |
| Immigrants | Guatemala | 0.0 /100 | #299 | Tragic 33.3% |
| Hispanics or Latinos | 0.0 /100 | #300 | Tragic 33.3% |
| Immigrants | Somalia | 0.0 /100 | #301 | Tragic 33.4% |
| Arapaho | 0.0 /100 | #302 | Tragic 33.4% |
| Americans | 0.0 /100 | #303 | Tragic 33.5% |
| Mexicans | 0.0 /100 | #304 | Tragic 33.6% |
| Immigrants | Central America | 0.0 /100 | #305 | Tragic 33.6% |
| Immigrants | Congo | 0.0 /100 | #306 | Tragic 33.8% |
Demographics Similar to Immigrants from West Indies by Single Mother Poverty
In terms of single mother poverty, the demographic groups most similar to Immigrants from West Indies are Immigrants from Bahamas (31.1%, a difference of 0.040%), Immigrants from Caribbean (31.1%, a difference of 0.13%), Immigrants from Bangladesh (31.1%, a difference of 0.16%), Belizean (31.0%, a difference of 0.21%), and Senegalese (31.0%, a difference of 0.32%).
| Demographics | Rating | Rank | Single Mother Poverty |
| Cape Verdeans | 0.8 /100 | #249 | Tragic 30.8% |
| Vietnamese | 0.7 /100 | #250 | Tragic 30.9% |
| Tlingit-Haida | 0.6 /100 | #251 | Tragic 30.9% |
| Alaska Natives | 0.6 /100 | #252 | Tragic 30.9% |
| Celtics | 0.6 /100 | #253 | Tragic 30.9% |
| Senegalese | 0.5 /100 | #254 | Tragic 31.0% |
| Belizeans | 0.5 /100 | #255 | Tragic 31.0% |
| Immigrants | West Indies | 0.4 /100 | #256 | Tragic 31.1% |
| Immigrants | Bahamas | 0.4 /100 | #257 | Tragic 31.1% |
| Immigrants | Caribbean | 0.4 /100 | #258 | Tragic 31.1% |
| Immigrants | Bangladesh | 0.4 /100 | #259 | Tragic 31.1% |
| Whites/Caucasians | 0.3 /100 | #260 | Tragic 31.2% |
| Immigrants | El Salvador | 0.3 /100 | #261 | Tragic 31.2% |
| Hmong | 0.3 /100 | #262 | Tragic 31.2% |
| Bahamians | 0.2 /100 | #263 | Tragic 31.3% |