Immigrants from Grenada vs Delaware Female Poverty Among 18-24 Year Olds
COMPARE
Immigrants from Grenada
Delaware
Female Poverty Among 18-24 Year Olds
Female Poverty Among 18-24 Year Olds Comparison
Immigrants from Grenada
Delaware
21.2%
FEMALE POVERTY AMONG 18-24 YEAR OLDS
1.2/ 100
METRIC RATING
255th/ 347
METRIC RANK
21.1%
FEMALE POVERTY AMONG 18-24 YEAR OLDS
1.6/ 100
METRIC RATING
253rd/ 347
METRIC RANK
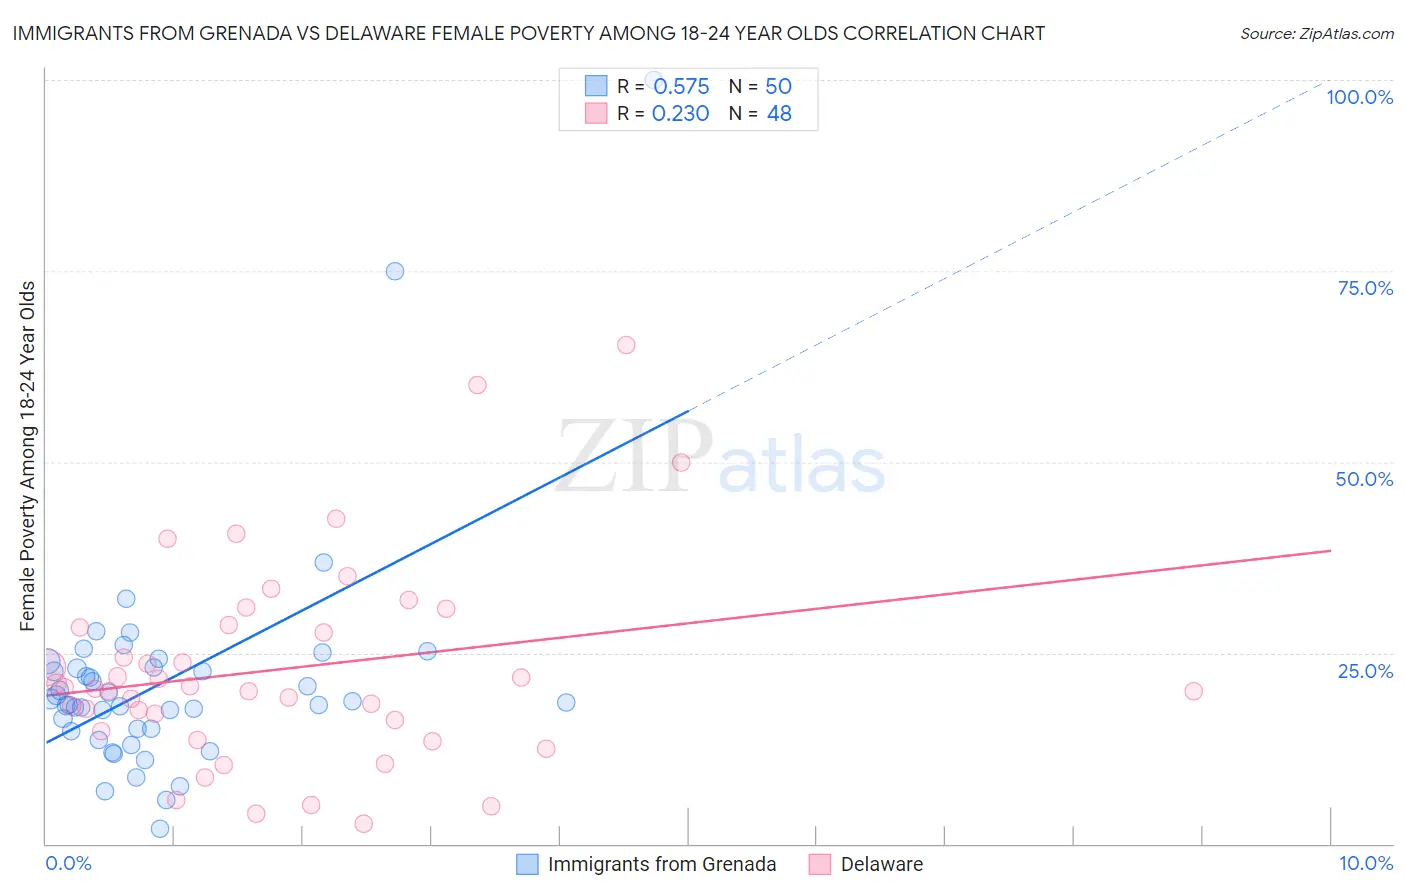
Immigrants from Grenada vs Delaware Female Poverty Among 18-24 Year Olds Correlation Chart
The statistical analysis conducted on geographies consisting of 66,763,632 people shows a substantial positive correlation between the proportion of Immigrants from Grenada and poverty level among females between the ages 18 and 24 in the United States with a correlation coefficient (R) of 0.575 and weighted average of 21.2%. Similarly, the statistical analysis conducted on geographies consisting of 95,183,522 people shows a weak positive correlation between the proportion of Delaware and poverty level among females between the ages 18 and 24 in the United States with a correlation coefficient (R) of 0.230 and weighted average of 21.1%, a difference of 0.32%.
Female Poverty Among 18-24 Year Olds Correlation Summary
| Measurement | Immigrants from Grenada | Delaware |
| Minimum | 2.0% | 2.6% |
| Maximum | 100.0% | 65.4% |
| Range | 98.0% | 62.8% |
| Mean | 21.4% | 22.8% |
| Median | 18.6% | 20.4% |
| Interquartile 25% (IQ1) | 15.0% | 15.5% |
| Interquartile 75% (IQ3) | 23.1% | 28.5% |
| Interquartile Range (IQR) | 8.1% | 13.0% |
| Standard Deviation (Sample) | 15.4% | 13.3% |
| Standard Deviation (Population) | 15.2% | 13.1% |
Demographics Similar to Immigrants from Grenada and Delaware by Female Poverty Among 18-24 Year Olds
In terms of female poverty among 18-24 year olds, the demographic groups most similar to Immigrants from Grenada are British West Indian (21.2%, a difference of 0.030%), Tsimshian (21.2%, a difference of 0.15%), Taiwanese (21.2%, a difference of 0.26%), South African (21.1%, a difference of 0.36%), and West Indian (21.1%, a difference of 0.54%). Similarly, the demographic groups most similar to Delaware are South African (21.1%, a difference of 0.040%), West Indian (21.1%, a difference of 0.23%), British West Indian (21.2%, a difference of 0.29%), Immigrants from West Indies (21.0%, a difference of 0.43%), and Tsimshian (21.2%, a difference of 0.47%).
| Demographics | Rating | Rank | Female Poverty Among 18-24 Year Olds |
| Immigrants | Thailand | 3.4 /100 | #244 | Tragic 20.9% |
| Aleuts | 3.3 /100 | #245 | Tragic 20.9% |
| Immigrants | Australia | 3.1 /100 | #246 | Tragic 20.9% |
| Immigrants | Africa | 3.0 /100 | #247 | Tragic 21.0% |
| Immigrants | Kenya | 2.5 /100 | #248 | Tragic 21.0% |
| Carpatho Rusyns | 2.5 /100 | #249 | Tragic 21.0% |
| Immigrants | West Indies | 2.2 /100 | #250 | Tragic 21.0% |
| West Indians | 1.9 /100 | #251 | Tragic 21.1% |
| South Africans | 1.6 /100 | #252 | Tragic 21.1% |
| Delaware | 1.6 /100 | #253 | Tragic 21.1% |
| British West Indians | 1.2 /100 | #254 | Tragic 21.2% |
| Immigrants | Grenada | 1.2 /100 | #255 | Tragic 21.2% |
| Tsimshian | 1.0 /100 | #256 | Tragic 21.2% |
| Taiwanese | 1.0 /100 | #257 | Tragic 21.2% |
| Vietnamese | 0.6 /100 | #258 | Tragic 21.4% |
| Immigrants | France | 0.6 /100 | #259 | Tragic 21.4% |
| Immigrants | Norway | 0.6 /100 | #260 | Tragic 21.4% |
| Immigrants | Bahamas | 0.5 /100 | #261 | Tragic 21.4% |
| Immigrants | Eastern Africa | 0.4 /100 | #262 | Tragic 21.4% |
| Icelanders | 0.3 /100 | #263 | Tragic 21.5% |
| Hondurans | 0.3 /100 | #264 | Tragic 21.5% |