Immigrants from Greece vs Moroccan Poverty
COMPARE
Immigrants from Greece
Moroccan
Poverty
Poverty Comparison
Immigrants from Greece
Moroccans
10.8%
POVERTY
99.3/ 100
METRIC RATING
37th/ 347
METRIC RANK
13.2%
POVERTY
5.2/ 100
METRIC RATING
211th/ 347
METRIC RANK
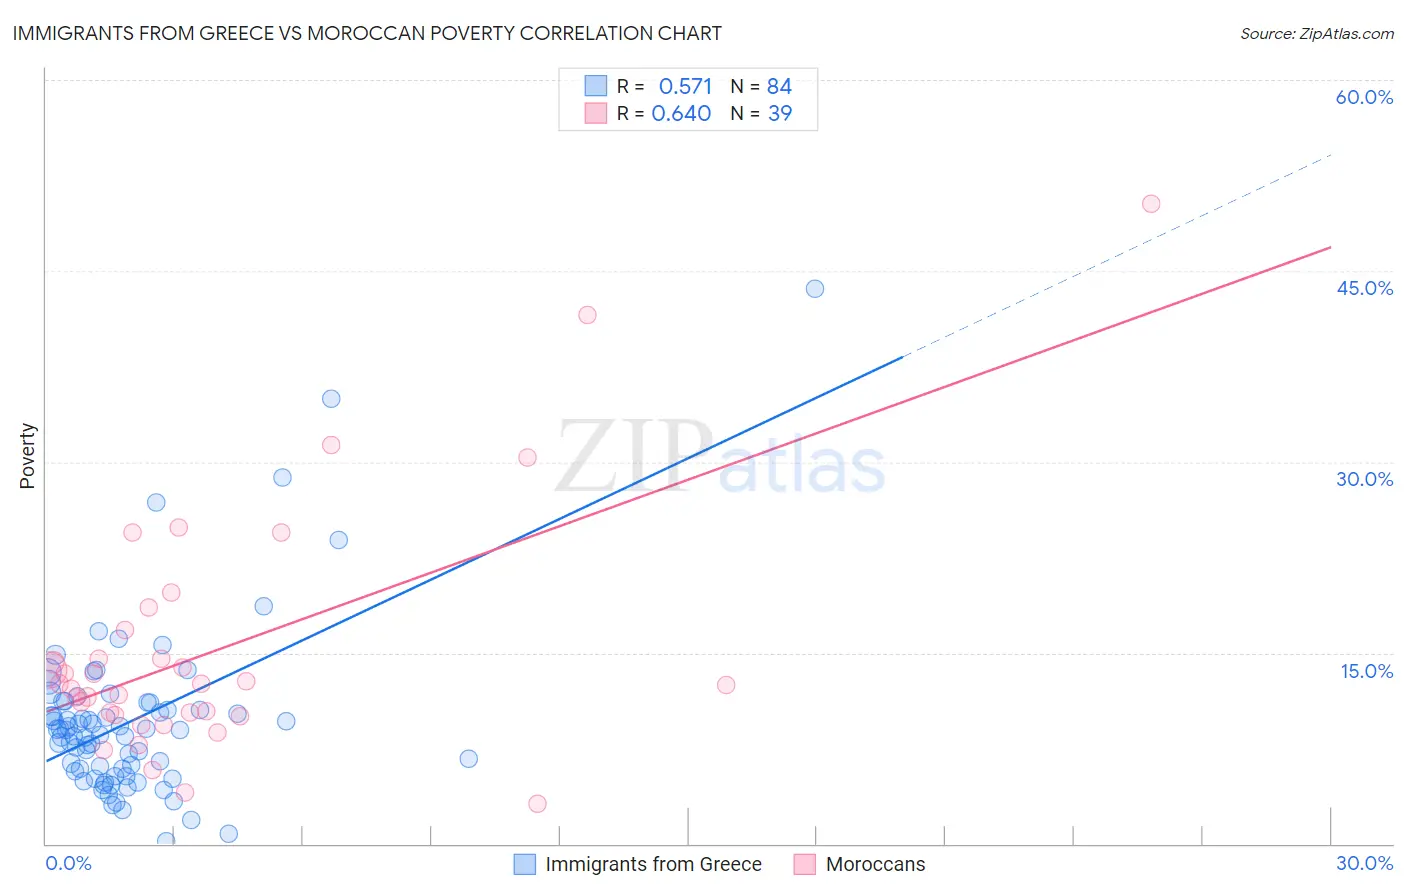
Immigrants from Greece vs Moroccan Poverty Correlation Chart
The statistical analysis conducted on geographies consisting of 216,856,400 people shows a substantial positive correlation between the proportion of Immigrants from Greece and poverty level in the United States with a correlation coefficient (R) of 0.571 and weighted average of 10.8%. Similarly, the statistical analysis conducted on geographies consisting of 201,757,500 people shows a significant positive correlation between the proportion of Moroccans and poverty level in the United States with a correlation coefficient (R) of 0.640 and weighted average of 13.2%, a difference of 21.7%.
Poverty Correlation Summary
| Measurement | Immigrants from Greece | Moroccan |
| Minimum | 0.19% | 3.2% |
| Maximum | 43.6% | 50.3% |
| Range | 43.4% | 47.1% |
| Mean | 9.7% | 15.3% |
| Median | 8.9% | 12.5% |
| Interquartile 25% (IQ1) | 5.8% | 10.1% |
| Interquartile 75% (IQ3) | 11.1% | 16.7% |
| Interquartile Range (IQR) | 5.3% | 6.6% |
| Standard Deviation (Sample) | 6.8% | 9.6% |
| Standard Deviation (Population) | 6.8% | 9.5% |
Similar Demographics by Poverty
Demographics Similar to Immigrants from Greece by Poverty
In terms of poverty, the demographic groups most similar to Immigrants from Greece are Czech (10.8%, a difference of 0.050%), Cypriot (10.8%, a difference of 0.10%), Immigrants from Pakistan (10.8%, a difference of 0.13%), Tongan (10.8%, a difference of 0.17%), and Russian (10.9%, a difference of 0.18%).
| Demographics | Rating | Rank | Poverty |
| Danes | 99.5 /100 | #30 | Exceptional 10.7% |
| Poles | 99.5 /100 | #31 | Exceptional 10.7% |
| Iranians | 99.5 /100 | #32 | Exceptional 10.7% |
| Macedonians | 99.4 /100 | #33 | Exceptional 10.8% |
| Immigrants | Poland | 99.4 /100 | #34 | Exceptional 10.8% |
| Tongans | 99.4 /100 | #35 | Exceptional 10.8% |
| Cypriots | 99.3 /100 | #36 | Exceptional 10.8% |
| Immigrants | Greece | 99.3 /100 | #37 | Exceptional 10.8% |
| Czechs | 99.3 /100 | #38 | Exceptional 10.8% |
| Immigrants | Pakistan | 99.3 /100 | #39 | Exceptional 10.8% |
| Russians | 99.3 /100 | #40 | Exceptional 10.9% |
| Immigrants | Iran | 99.2 /100 | #41 | Exceptional 10.9% |
| Koreans | 99.2 /100 | #42 | Exceptional 10.9% |
| Immigrants | Singapore | 99.2 /100 | #43 | Exceptional 10.9% |
| Immigrants | Moldova | 99.1 /100 | #44 | Exceptional 10.9% |
Demographics Similar to Moroccans by Poverty
In terms of poverty, the demographic groups most similar to Moroccans are Immigrants from the Azores (13.1%, a difference of 0.35%), Malaysian (13.1%, a difference of 0.38%), Ugandan (13.1%, a difference of 0.42%), Immigrants (13.2%, a difference of 0.45%), and Panamanian (13.1%, a difference of 0.57%).
| Demographics | Rating | Rank | Poverty |
| Immigrants | Western Asia | 14.1 /100 | #204 | Poor 12.9% |
| Tsimshian | 9.2 /100 | #205 | Tragic 13.0% |
| Immigrants | Eastern Africa | 7.0 /100 | #206 | Tragic 13.1% |
| Panamanians | 6.6 /100 | #207 | Tragic 13.1% |
| Ugandans | 6.2 /100 | #208 | Tragic 13.1% |
| Malaysians | 6.1 /100 | #209 | Tragic 13.1% |
| Immigrants | Azores | 6.1 /100 | #210 | Tragic 13.1% |
| Moroccans | 5.2 /100 | #211 | Tragic 13.2% |
| Immigrants | Immigrants | 4.3 /100 | #212 | Tragic 13.2% |
| Immigrants | Panama | 4.1 /100 | #213 | Tragic 13.3% |
| Bermudans | 3.7 /100 | #214 | Tragic 13.3% |
| Japanese | 3.3 /100 | #215 | Tragic 13.3% |
| Immigrants | Nonimmigrants | 3.3 /100 | #216 | Tragic 13.3% |
| Immigrants | Uzbekistan | 3.2 /100 | #217 | Tragic 13.3% |
| Immigrants | Thailand | 3.1 /100 | #218 | Tragic 13.3% |