Immigrants from Greece vs Cuban Female Poverty Among 18-24 Year Olds
COMPARE
Immigrants from Greece
Cuban
Female Poverty Among 18-24 Year Olds
Female Poverty Among 18-24 Year Olds Comparison
Immigrants from Greece
Cubans
17.9%
FEMALE POVERTY AMONG 18-24 YEAR OLDS
100.0/ 100
METRIC RATING
35th/ 347
METRIC RANK
17.2%
FEMALE POVERTY AMONG 18-24 YEAR OLDS
100.0/ 100
METRIC RATING
15th/ 347
METRIC RANK
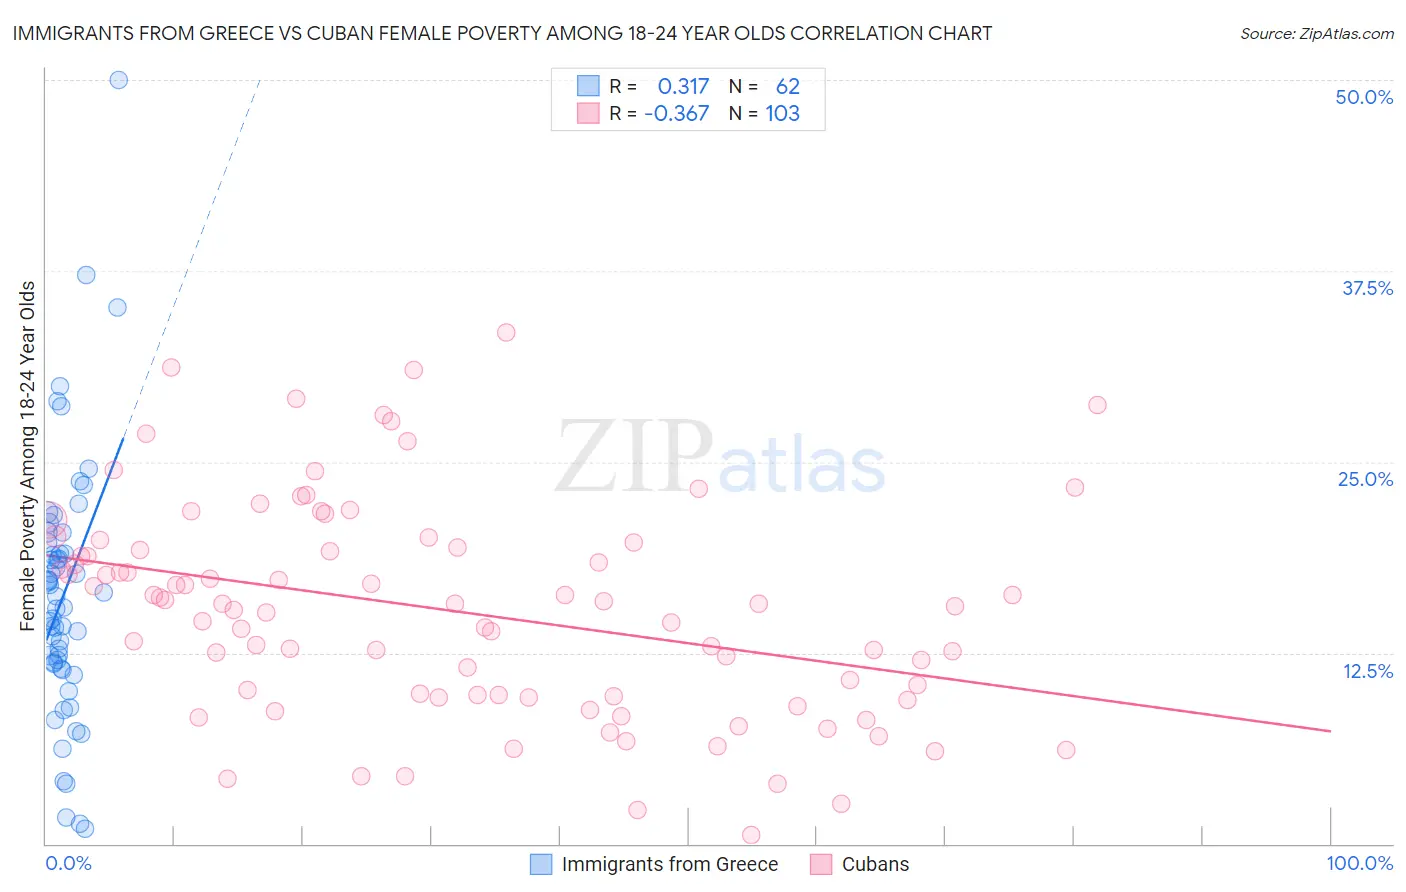
Immigrants from Greece vs Cuban Female Poverty Among 18-24 Year Olds Correlation Chart
The statistical analysis conducted on geographies consisting of 212,433,308 people shows a mild positive correlation between the proportion of Immigrants from Greece and poverty level among females between the ages 18 and 24 in the United States with a correlation coefficient (R) of 0.317 and weighted average of 17.9%. Similarly, the statistical analysis conducted on geographies consisting of 436,191,738 people shows a mild negative correlation between the proportion of Cubans and poverty level among females between the ages 18 and 24 in the United States with a correlation coefficient (R) of -0.367 and weighted average of 17.2%, a difference of 4.2%.
Female Poverty Among 18-24 Year Olds Correlation Summary
| Measurement | Immigrants from Greece | Cuban |
| Minimum | 0.95% | 0.55% |
| Maximum | 50.0% | 33.5% |
| Range | 49.0% | 32.9% |
| Mean | 16.4% | 15.2% |
| Median | 15.8% | 15.7% |
| Interquartile 25% (IQ1) | 11.8% | 9.6% |
| Interquartile 75% (IQ3) | 19.8% | 19.4% |
| Interquartile Range (IQR) | 8.0% | 9.7% |
| Standard Deviation (Sample) | 8.6% | 7.0% |
| Standard Deviation (Population) | 8.5% | 7.0% |
Demographics Similar to Immigrants from Greece and Cubans by Female Poverty Among 18-24 Year Olds
In terms of female poverty among 18-24 year olds, the demographic groups most similar to Immigrants from Greece are Immigrants from Nicaragua (17.9%, a difference of 0.040%), Native Hawaiian (17.9%, a difference of 0.15%), Immigrants from Moldova (17.9%, a difference of 0.18%), Immigrants from Vietnam (17.8%, a difference of 0.43%), and Immigrants from South Eastern Asia (17.8%, a difference of 0.61%). Similarly, the demographic groups most similar to Cubans are Peruvian (17.2%, a difference of 0.23%), Immigrants from Taiwan (17.3%, a difference of 0.48%), Immigrants from Colombia (17.3%, a difference of 0.94%), Immigrants from Lithuania (17.4%, a difference of 1.3%), and Immigrants from Venezuela (17.4%, a difference of 1.5%).
| Demographics | Rating | Rank | Female Poverty Among 18-24 Year Olds |
| Cubans | 100.0 /100 | #15 | Exceptional 17.2% |
| Peruvians | 100.0 /100 | #16 | Exceptional 17.2% |
| Immigrants | Taiwan | 100.0 /100 | #17 | Exceptional 17.3% |
| Immigrants | Colombia | 100.0 /100 | #18 | Exceptional 17.3% |
| Immigrants | Lithuania | 100.0 /100 | #19 | Exceptional 17.4% |
| Immigrants | Venezuela | 100.0 /100 | #20 | Exceptional 17.4% |
| Bolivians | 100.0 /100 | #21 | Exceptional 17.4% |
| Immigrants | Hong Kong | 100.0 /100 | #22 | Exceptional 17.5% |
| Immigrants | North Macedonia | 100.0 /100 | #23 | Exceptional 17.6% |
| Maltese | 100.0 /100 | #24 | Exceptional 17.6% |
| Immigrants | South Central Asia | 100.0 /100 | #25 | Exceptional 17.6% |
| Immigrants | Fiji | 100.0 /100 | #26 | Exceptional 17.7% |
| Colombians | 100.0 /100 | #27 | Exceptional 17.7% |
| Venezuelans | 100.0 /100 | #28 | Exceptional 17.7% |
| Portuguese | 100.0 /100 | #29 | Exceptional 17.8% |
| Immigrants | South Eastern Asia | 100.0 /100 | #30 | Exceptional 17.8% |
| Immigrants | Vietnam | 100.0 /100 | #31 | Exceptional 17.8% |
| Immigrants | Moldova | 100.0 /100 | #32 | Exceptional 17.9% |
| Native Hawaiians | 100.0 /100 | #33 | Exceptional 17.9% |
| Immigrants | Nicaragua | 100.0 /100 | #34 | Exceptional 17.9% |
| Immigrants | Greece | 100.0 /100 | #35 | Exceptional 17.9% |