Immigrants from Greece vs Colville Child Poverty Under the Age of 16

COMPARE

Immigrants from Greece
Race
Ancestry
AfghanAfricanAlaska NativeAlaskan AthabascanAlbanianAleutAlsatianAmericanApacheArabArapahoArgentineanArmenianAssyrian/Chaldean/SyriacAustralianAustrianBahamianBangladeshiBarbadianBasqueBelgianBelizeanBermudanBhutaneseBlackfeetBolivianBrazilianBritishBritish West IndianBulgarianBurmeseCajunCambodianCanadianCape VerdeanCarpatho RusynCelticCentral AmericanCentral American IndianCherokeeCheyenneChickasawChileanChineseChippewaChoctawColombianComancheCosta RicanCreeCreekCroatianCrowCubanCypriotCzechCzechoslovakianDanishDelawareDominicanDutchDutch West IndianEastern EuropeanEcuadorianEgyptianEnglishEstonianEthiopianEuropeanFijianFilipinoFinnishFrenchFrench American IndianFrench CanadianGermanGerman RussianGhanaianGreekGuamanian/ChamorroGuatemalanGuyaneseHaitianHmongHonduranHopiHoumaHungarianIcelanderIndian (Asian)IndonesianInupiatIranianIraqiIrishIroquoisIsraeliItalianJamaicanJapaneseJordanianKenyanKiowaKoreanLaotianLatvianLebaneseLiberianLithuanianLumbeeLuxembourgerMacedonianMalaysianMalteseMarshalleseMenomineeMexicanMexican American IndianMongolianMoroccanNative HawaiianNavajoNepaleseNew ZealanderNicaraguanNigerianNorthern EuropeanNorwegianOkinawanOsageOttawaPaiutePakistaniPalestinianPanamanianParaguayanPennsylvania GermanPeruvianPimaPolishPortuguesePotawatomiPuebloPuerto RicanPuget Sound SalishRomanianRussianSalvadoranSamoanScandinavianScotch-IrishScottishSeminoleSenegaleseSerbianShoshoneSierra LeoneanSiouxSlavicSlovakSloveneSomaliSouth AfricanSouth AmericanSouth American IndianSoviet UnionSpaniardSpanishSpanish AmericanSpanish American IndianSri LankanSubsaharan AfricanSudaneseSwedishSwissSyrianTaiwaneseThaiTlingit-HaidaTohono O'OdhamTonganTrinidadian and TobagonianTsimshianTurkishU.S. Virgin IslanderUgandanUkrainianUruguayanUteVenezuelanVietnameseWelshWest IndianYakamaYaquiYugoslavianYumanYup'ikZimbabwean
Immigration
NonimmigrantsImmigrantsAfghanistanAfricaAlbaniaArgentinaArmeniaAsiaAustraliaAustriaBahamasBangladeshBarbadosBelarusBelgiumBelizeBoliviaBosnia and HerzegovinaBrazilBulgariaBurma/MyanmarCabo VerdeCambodiaCameroonCanadaCaribbeanCentral AmericaChileChinaColombiaCongoCosta RicaCroatiaCubaCzechoslovakiaDenmarkDominicaDominican RepublicEastern AfricaEastern AsiaEastern EuropeEcuadorEgyptEl SalvadorEnglandEritreaEthiopiaEuropeFijiFranceGermanyGhanaGreeceGrenadaGuatemalaGuyanaHaitiHondurasHong KongHungaryIndiaIndonesiaIranIraqIrelandIsraelItalyJamaicaJapanJordanKazakhstanKenyaKoreaKuwaitLaosLatin AmericaLatviaLebanonLiberiaLithuaniaMalaysiaMexicoMicronesiaMiddle AfricaMoldovaMoroccoNepalNetherlandsNicaraguaNigeriaNorth AmericaNorth MacedoniaNorthern AfricaNorthern EuropeNorwayOceaniaPakistanPanamaPeruPhilippinesPolandPortugalRomaniaRussiaSaudi ArabiaScotlandSenegalSerbiaSierra LeoneSingaporeSomaliaSouth AfricaSouth AmericaSouth Central AsiaSouth Eastern AsiaSouthern EuropeSpainSri LankaSt. Vincent and the GrenadinesSudanSwedenSwitzerlandSyriaTaiwanThailandTrinidad and TobagoTurkeyUgandaUkraineUruguayUzbekistanVenezuelaVietnamWest IndiesWestern AfricaWestern AsiaWestern EuropeYemenZaireZimbabweAzores
Colville
Race
Ancestry
AfghanAfricanAlaska NativeAlaskan AthabascanAlbanianAleutAlsatianAmericanApacheArabArapahoArgentineanArmenianAssyrian/Chaldean/SyriacAustralianAustrianBahamianBangladeshiBarbadianBasqueBelgianBelizeanBermudanBhutaneseBlackfeetBolivianBrazilianBritishBritish West IndianBulgarianBurmeseCajunCambodianCanadianCape VerdeanCarpatho RusynCelticCentral AmericanCentral American IndianCherokeeCheyenneChickasawChileanChineseChippewaChoctawColombianColvilleComancheCosta RicanCreeCreekCroatianCrowCubanCypriotCzechCzechoslovakianDanishDelawareDominicanDutchDutch West IndianEastern EuropeanEcuadorianEgyptianEnglishEstonianEthiopianEuropeanFijianFilipinoFinnishFrenchFrench American IndianFrench CanadianGermanGerman RussianGhanaianGreekGuamanian/ChamorroGuatemalanGuyaneseHaitianHmongHonduranHopiHoumaHungarianIcelanderIndian (Asian)IndonesianInupiatIranianIraqiIrishIroquoisIsraeliItalianJamaicanJapaneseJordanianKenyanKiowaKoreanLaotianLatvianLebaneseLiberianLithuanianLumbeeLuxembourgerMacedonianMalaysianMalteseMarshalleseMenomineeMexicanMexican American IndianMongolianMoroccanNative HawaiianNavajoNepaleseNew ZealanderNicaraguanNigerianNorthern EuropeanNorwegianOkinawanOsageOttawaPaiutePakistaniPalestinianPanamanianParaguayanPennsylvania GermanPeruvianPimaPolishPortuguesePotawatomiPuebloPuerto RicanPuget Sound SalishRomanianRussianSalvadoranSamoanScandinavianScotch-IrishScottishSeminoleSenegaleseSerbianShoshoneSierra LeoneanSiouxSlavicSlovakSloveneSomaliSouth AfricanSouth AmericanSouth American IndianSoviet UnionSpaniardSpanishSpanish AmericanSpanish American IndianSri LankanSubsaharan AfricanSudaneseSwedishSwissSyrianTaiwaneseThaiTlingit-HaidaTohono O'OdhamTonganTrinidadian and TobagonianTsimshianTurkishU.S. Virgin IslanderUgandanUkrainianUruguayanUteVenezuelanVietnameseWelshWest IndianYakamaYaquiYugoslavianYumanYup'ikZimbabwean
Immigration
NonimmigrantsImmigrantsAfghanistanAfricaAlbaniaArgentinaArmeniaAsiaAustraliaAustriaBahamasBangladeshBarbadosBelarusBelgiumBelizeBoliviaBosnia and HerzegovinaBrazilBulgariaBurma/MyanmarCabo VerdeCambodiaCameroonCanadaCaribbeanCentral AmericaChileChinaColombiaCongoCosta RicaCroatiaCubaCzechoslovakiaDenmarkDominicaDominican RepublicEastern AfricaEastern AsiaEastern EuropeEcuadorEgyptEl SalvadorEnglandEritreaEthiopiaEuropeFijiFranceGermanyGhanaGrenadaGuatemalaGuyanaHaitiHondurasHong KongHungaryIndiaIndonesiaIranIraqIrelandIsraelItalyJamaicaJapanJordanKazakhstanKenyaKoreaKuwaitLaosLatin AmericaLatviaLebanonLiberiaLithuaniaMalaysiaMexicoMicronesiaMiddle AfricaMoldovaMoroccoNepalNetherlandsNicaraguaNigeriaNorth AmericaNorth MacedoniaNorthern AfricaNorthern EuropeNorwayOceaniaPakistanPanamaPeruPhilippinesPolandPortugalRomaniaRussiaSaudi ArabiaScotlandSenegalSerbiaSierra LeoneSingaporeSomaliaSouth AfricaSouth AmericaSouth Central AsiaSouth Eastern AsiaSouthern EuropeSpainSri LankaSt. Vincent and the GrenadinesSudanSwedenSwitzerlandSyriaTaiwanThailandTrinidad and TobagoTurkeyUgandaUkraineUruguayUzbekistanVenezuelaVietnamWest IndiesWestern AfricaWestern AsiaWestern EuropeYemenZaireZimbabweAzores
Child Poverty Under the Age of 16
Income
Poverty
Unemployment
Labor Participation
Family Structure
Vehicle Availability
Education Level
Disability

Child Poverty Under the Age of 16 Comparison

Immigrants from Greece

Colville

Exceptional
Tragic
13.9%
CHILD POVERTY UNDER THE AGE OF 16
99.1/ 100
METRIC RATING
51st/ 347
METRIC RANK
23.0%
CHILD POVERTY UNDER THE AGE OF 16
0.0/ 100
METRIC RATING
328th/ 347
METRIC RANK

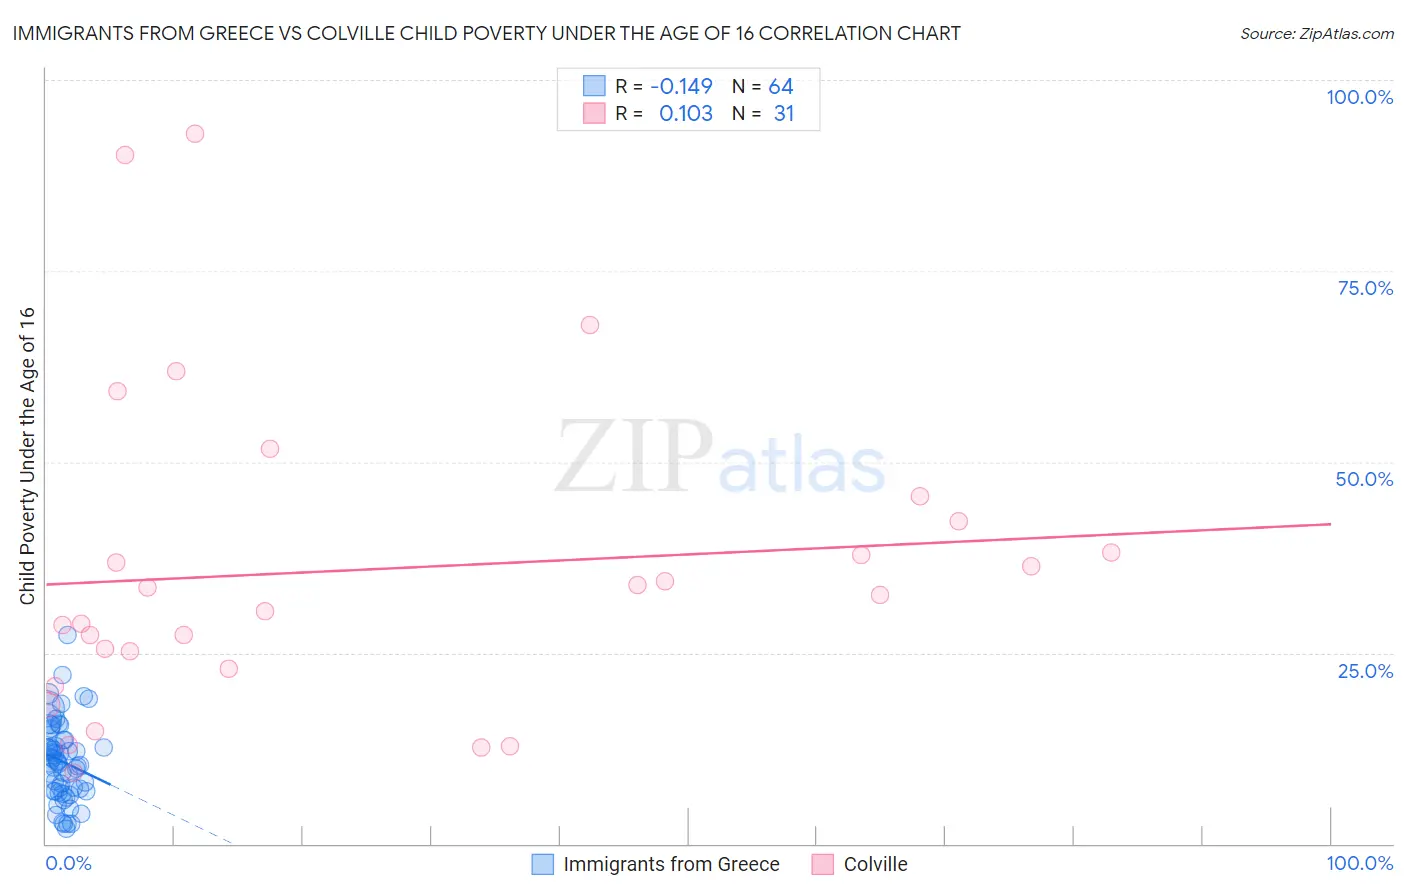
Immigrants from Greece vs Colville Child Poverty Under the Age of 16 Correlation Chart

The statistical analysis conducted on geographies consisting of 215,141,811 people shows a poor negative correlation between the proportion of Immigrants from Greece and poverty level among children under the age of 16 in the United States with a correlation coefficient (R) of -0.149 and weighted average of 13.9%. Similarly, the statistical analysis conducted on geographies consisting of 34,640,964 people shows a poor positive correlation between the proportion of Colville and poverty level among children under the age of 16 in the United States with a correlation coefficient (R) of 0.103 and weighted average of 23.0%, a difference of 65.5%.
Immigrants from Greece vs Colville Child Poverty Under the Age of 16

Child Poverty Under the Age of 16 Correlation Summary

MeasurementImmigrants from GreeceColville
Minimum2.0%9.3%
Maximum27.3%93.0%
Range25.3%83.7%
Mean10.8%35.9%
Median10.6%32.6%
Interquartile 25% (IQ1)6.9%23.0%
Interquartile 75% (IQ3)13.1%42.3%
Interquartile Range (IQR)6.2%19.3%
Standard Deviation (Sample)5.1%20.7%
Standard Deviation (Population)5.1%20.4%

Similar Demographics by Child Poverty Under the Age of 16

Demographics Similar to Immigrants from Greece by Child Poverty Under the Age of 16

In terms of child poverty under the age of 16, the demographic groups most similar to Immigrants from Greece are Immigrants from Czechoslovakia (13.9%, a difference of 0.12%), Italian (13.9%, a difference of 0.35%), Korean (13.9%, a difference of 0.38%), Estonian (13.9%, a difference of 0.44%), and Immigrants from Asia (13.8%, a difference of 0.60%).
DemographicsRating | RankChild Poverty Under the Age of 16
Greeks
99.3
/100
|
#44
Exceptional
13.8%
Czechs
99.3
/100
|
#45
Exceptional
13.8%
Immigrants | Asia
99.2
/100
|
#46
Exceptional
13.8%
Estonians
99.2
/100
|
#47
Exceptional
13.9%
Koreans
99.2
/100
|
#48
Exceptional
13.9%
Italians
99.2
/100
|
#49
Exceptional
13.9%
Immigrants | Czechoslovakia
99.1
/100
|
#50
Exceptional
13.9%
Immigrants | Greece
99.1
/100
|
#51
Exceptional
13.9%
Poles
98.9
/100
|
#52
Exceptional
14.0%
Immigrants | Israel
98.8
/100
|
#53
Exceptional
14.1%
Tsimshian
98.8
/100
|
#54
Exceptional
14.1%
Immigrants | Indonesia
98.7
/100
|
#55
Exceptional
14.1%
Immigrants | Serbia
98.7
/100
|
#56
Exceptional
14.1%
Immigrants | Belgium
98.6
/100
|
#57
Exceptional
14.1%
Immigrants | Pakistan
98.6
/100
|
#58
Exceptional
14.1%

Demographics Similar to Colville by Child Poverty Under the Age of 16

In terms of child poverty under the age of 16, the demographic groups most similar to Colville are Menominee (23.0%, a difference of 0.38%), Immigrants from Honduras (22.7%, a difference of 1.5%), Immigrants from Congo (22.5%, a difference of 2.3%), Central American Indian (22.5%, a difference of 2.5%), and Paiute (22.4%, a difference of 2.8%).
DemographicsRating | RankChild Poverty Under the Age of 16
Kiowa
0.0
/100
|
#321
Tragic
22.2%
Hondurans
0.0
/100
|
#322
Tragic
22.2%
Paiute
0.0
/100
|
#323
Tragic
22.4%
Central American Indians
0.0
/100
|
#324
Tragic
22.5%
Immigrants | Congo
0.0
/100
|
#325
Tragic
22.5%
Immigrants | Honduras
0.0
/100
|
#326
Tragic
22.7%
Menominee
0.0
/100
|
#327
Tragic
23.0%
Colville
0.0
/100
|
#328
Tragic
23.0%
Dominicans
0.0
/100
|
#329
Tragic
23.8%
Natives/Alaskans
0.0
/100
|
#330
Tragic
23.8%
Apache
0.0
/100
|
#331
Tragic
23.8%
Pueblo
0.0
/100
|
#332
Tragic
23.9%
Immigrants | Dominican Republic
0.0
/100
|
#333
Tragic
24.0%
Blacks/African Americans
0.0
/100
|
#334
Tragic
24.4%
Houma
0.0
/100
|
#335
Tragic
24.9%