Immigrants from Ghana vs Hopi Poverty
COMPARE
Immigrants from Ghana
Hopi
Poverty
Poverty Comparison
Immigrants from Ghana
Hopi
14.2%
POVERTY
0.2/ 100
METRIC RATING
249th/ 347
METRIC RANK
20.8%
POVERTY
0.0/ 100
METRIC RATING
341st/ 347
METRIC RANK
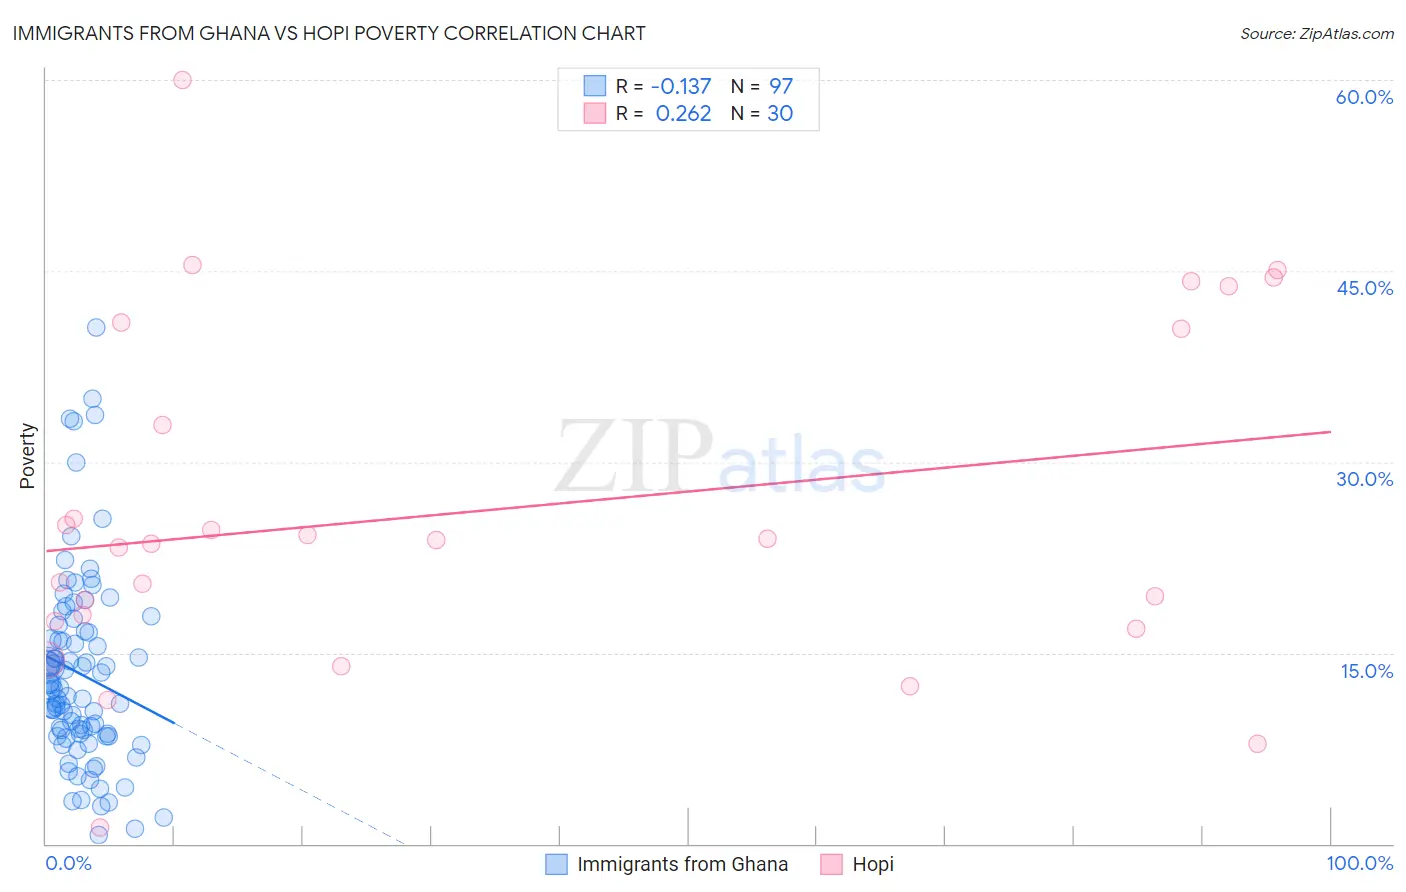
Immigrants from Ghana vs Hopi Poverty Correlation Chart
The statistical analysis conducted on geographies consisting of 199,808,032 people shows a poor negative correlation between the proportion of Immigrants from Ghana and poverty level in the United States with a correlation coefficient (R) of -0.137 and weighted average of 14.2%. Similarly, the statistical analysis conducted on geographies consisting of 74,733,532 people shows a weak positive correlation between the proportion of Hopi and poverty level in the United States with a correlation coefficient (R) of 0.262 and weighted average of 20.8%, a difference of 47.3%.
Poverty Correlation Summary
| Measurement | Immigrants from Ghana | Hopi |
| Minimum | 0.71% | 1.3% |
| Maximum | 40.5% | 60.0% |
| Range | 39.8% | 58.7% |
| Mean | 13.4% | 26.2% |
| Median | 12.2% | 23.8% |
| Interquartile 25% (IQ1) | 8.5% | 17.4% |
| Interquartile 75% (IQ3) | 16.6% | 40.4% |
| Interquartile Range (IQR) | 8.1% | 23.0% |
| Standard Deviation (Sample) | 7.6% | 13.6% |
| Standard Deviation (Population) | 7.5% | 13.4% |
Similar Demographics by Poverty
Demographics Similar to Immigrants from Ghana by Poverty
In terms of poverty, the demographic groups most similar to Immigrants from Ghana are Immigrants from Western Africa (14.1%, a difference of 0.090%), Liberian (14.1%, a difference of 0.11%), Cree (14.2%, a difference of 0.30%), Immigrants from Burma/Myanmar (14.2%, a difference of 0.39%), and Potawatomi (14.1%, a difference of 0.40%).
| Demographics | Rating | Rank | Poverty |
| Ecuadorians | 0.4 /100 | #242 | Tragic 14.0% |
| Sudanese | 0.3 /100 | #243 | Tragic 14.0% |
| Nepalese | 0.3 /100 | #244 | Tragic 14.0% |
| Immigrants | Sudan | 0.3 /100 | #245 | Tragic 14.1% |
| Potawatomi | 0.3 /100 | #246 | Tragic 14.1% |
| Liberians | 0.2 /100 | #247 | Tragic 14.1% |
| Immigrants | Western Africa | 0.2 /100 | #248 | Tragic 14.1% |
| Immigrants | Ghana | 0.2 /100 | #249 | Tragic 14.2% |
| Cree | 0.2 /100 | #250 | Tragic 14.2% |
| Immigrants | Burma/Myanmar | 0.2 /100 | #251 | Tragic 14.2% |
| Spanish American Indians | 0.2 /100 | #252 | Tragic 14.2% |
| Immigrants | Trinidad and Tobago | 0.2 /100 | #253 | Tragic 14.2% |
| Immigrants | El Salvador | 0.1 /100 | #254 | Tragic 14.3% |
| Immigrants | Ecuador | 0.1 /100 | #255 | Tragic 14.3% |
| Mexican American Indians | 0.1 /100 | #256 | Tragic 14.3% |
Demographics Similar to Hopi by Poverty
In terms of poverty, the demographic groups most similar to Hopi are Yup'ik (20.8%, a difference of 0.18%), Crow (20.7%, a difference of 0.93%), Immigrants from Yemen (21.5%, a difference of 3.2%), Yuman (20.2%, a difference of 3.2%), and Pima (21.9%, a difference of 4.8%).
| Demographics | Rating | Rank | Poverty |
| Houma | 0.0 /100 | #333 | Tragic 18.4% |
| Apache | 0.0 /100 | #334 | Tragic 18.4% |
| Cheyenne | 0.0 /100 | #335 | Tragic 18.9% |
| Pueblo | 0.0 /100 | #336 | Tragic 19.4% |
| Sioux | 0.0 /100 | #337 | Tragic 19.8% |
| Yuman | 0.0 /100 | #338 | Tragic 20.2% |
| Crow | 0.0 /100 | #339 | Tragic 20.7% |
| Yup'ik | 0.0 /100 | #340 | Tragic 20.8% |
| Hopi | 0.0 /100 | #341 | Tragic 20.8% |
| Immigrants | Yemen | 0.0 /100 | #342 | Tragic 21.5% |
| Pima | 0.0 /100 | #343 | Tragic 21.9% |
| Lumbee | 0.0 /100 | #344 | Tragic 21.9% |
| Navajo | 0.0 /100 | #345 | Tragic 23.1% |
| Puerto Ricans | 0.0 /100 | #346 | Tragic 23.7% |
| Tohono O'odham | 0.0 /100 | #347 | Tragic 24.4% |