Immigrants from Germany vs South American Child Poverty Under the Age of 16
COMPARE
Immigrants from Germany
South American
Child Poverty Under the Age of 16
Child Poverty Under the Age of 16 Comparison
Immigrants from Germany
South Americans
15.8%
CHILD POVERTY UNDER THE AGE OF 16
67.3/ 100
METRIC RATING
164th/ 347
METRIC RANK
16.0%
CHILD POVERTY UNDER THE AGE OF 16
57.9/ 100
METRIC RATING
168th/ 347
METRIC RANK
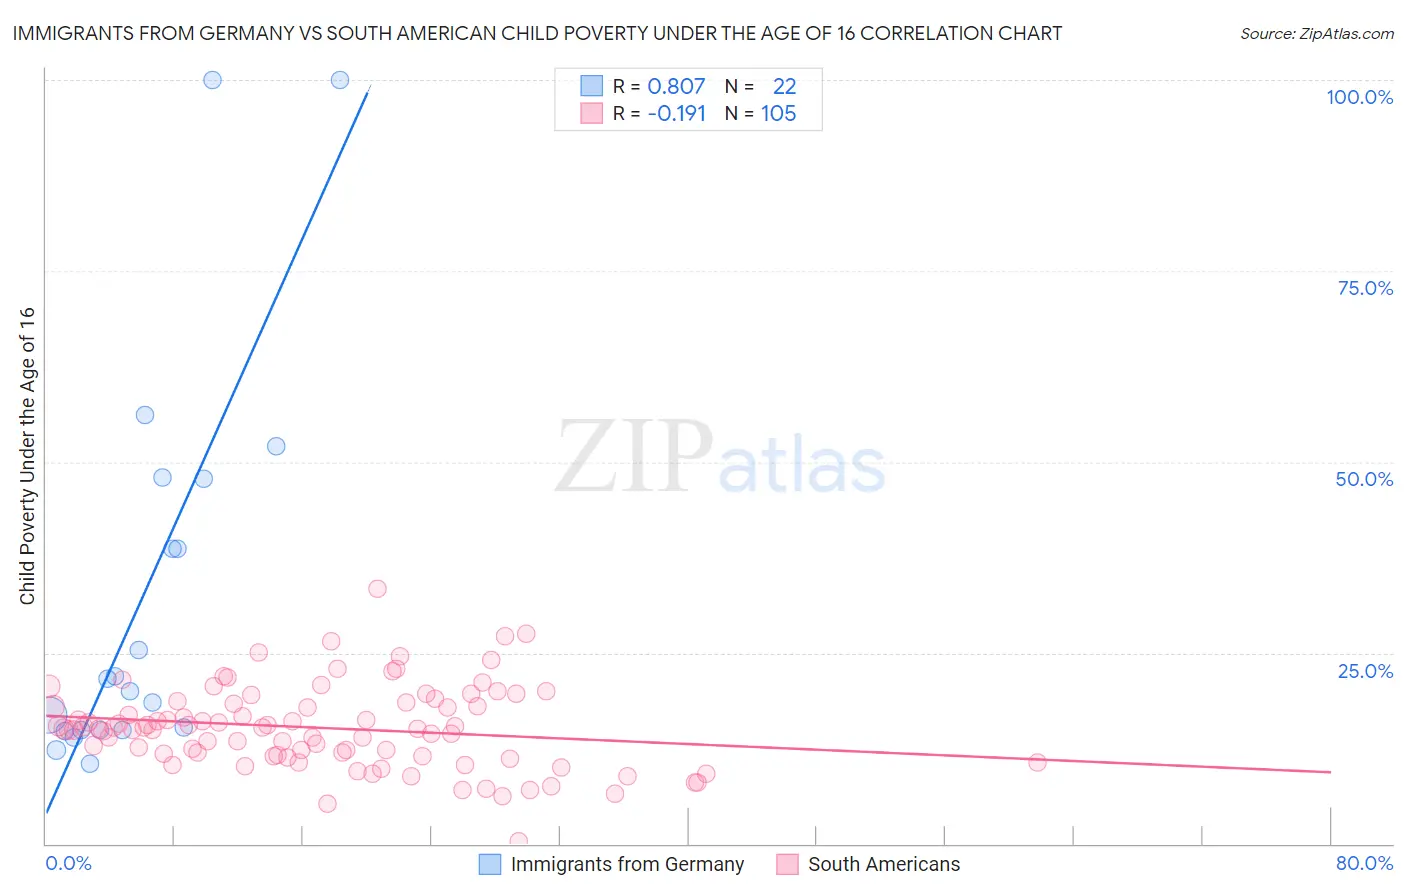
Immigrants from Germany vs South American Child Poverty Under the Age of 16 Correlation Chart
The statistical analysis conducted on geographies consisting of 458,231,020 people shows a very strong positive correlation between the proportion of Immigrants from Germany and poverty level among children under the age of 16 in the United States with a correlation coefficient (R) of 0.807 and weighted average of 15.8%. Similarly, the statistical analysis conducted on geographies consisting of 487,399,793 people shows a poor negative correlation between the proportion of South Americans and poverty level among children under the age of 16 in the United States with a correlation coefficient (R) of -0.191 and weighted average of 16.0%, a difference of 1.2%.
Child Poverty Under the Age of 16 Correlation Summary
| Measurement | Immigrants from Germany | South American |
| Minimum | 10.5% | 0.32% |
| Maximum | 100.0% | 33.3% |
| Range | 89.5% | 33.0% |
| Mean | 32.6% | 15.2% |
| Median | 20.8% | 15.1% |
| Interquartile 25% (IQ1) | 14.9% | 11.6% |
| Interquartile 75% (IQ3) | 47.8% | 18.4% |
| Interquartile Range (IQR) | 32.9% | 6.8% |
| Standard Deviation (Sample) | 26.1% | 5.4% |
| Standard Deviation (Population) | 25.5% | 5.4% |
Demographics Similar to Immigrants from Germany and South Americans by Child Poverty Under the Age of 16
In terms of child poverty under the age of 16, the demographic groups most similar to Immigrants from Germany are Colombian (15.8%, a difference of 0.040%), Yugoslavian (15.8%, a difference of 0.040%), Immigrants from Northern Africa (15.8%, a difference of 0.10%), Guamanian/Chamorro (15.9%, a difference of 0.13%), and Immigrants from Oceania (15.9%, a difference of 0.27%). Similarly, the demographic groups most similar to South Americans are Costa Rican (16.0%, a difference of 0.40%), Uruguayan (16.1%, a difference of 0.40%), Immigrants from Colombia (16.1%, a difference of 0.43%), Hungarian (16.2%, a difference of 0.67%), and Afghan (16.2%, a difference of 0.69%).
| Demographics | Rating | Rank | Child Poverty Under the Age of 16 |
| Immigrants | Venezuela | 74.9 /100 | #156 | Good 15.7% |
| Immigrants | Nepal | 72.9 /100 | #157 | Good 15.7% |
| Immigrants | Chile | 72.8 /100 | #158 | Good 15.7% |
| Immigrants | Fiji | 71.1 /100 | #159 | Good 15.8% |
| Immigrants | Albania | 70.7 /100 | #160 | Good 15.8% |
| Immigrants | Northern Africa | 68.1 /100 | #161 | Good 15.8% |
| Colombians | 67.6 /100 | #162 | Good 15.8% |
| Yugoslavians | 67.6 /100 | #163 | Good 15.8% |
| Immigrants | Germany | 67.3 /100 | #164 | Good 15.8% |
| Guamanians/Chamorros | 66.4 /100 | #165 | Good 15.9% |
| Immigrants | Oceania | 65.4 /100 | #166 | Good 15.9% |
| Costa Ricans | 61.1 /100 | #167 | Good 16.0% |
| South Americans | 57.9 /100 | #168 | Average 16.0% |
| Uruguayans | 54.7 /100 | #169 | Average 16.1% |
| Immigrants | Colombia | 54.4 /100 | #170 | Average 16.1% |
| Hungarians | 52.5 /100 | #171 | Average 16.2% |
| Afghans | 52.3 /100 | #172 | Average 16.2% |
| Immigrants | Saudi Arabia | 52.1 /100 | #173 | Average 16.2% |
| Whites/Caucasians | 50.0 /100 | #174 | Average 16.2% |
| Scotch-Irish | 47.1 /100 | #175 | Average 16.3% |
| Lebanese | 45.9 /100 | #176 | Average 16.3% |