Immigrants from Fiji vs Comanche Child Poverty Under the Age of 16

COMPARE

Immigrants from Fiji
Race
Ancestry
AfghanAfricanAlaska NativeAlaskan AthabascanAlbanianAleutAlsatianAmericanApacheArabArapahoArgentineanArmenianAssyrian/Chaldean/SyriacAustralianAustrianBahamianBangladeshiBarbadianBasqueBelgianBelizeanBermudanBhutaneseBlackfeetBolivianBrazilianBritishBritish West IndianBulgarianBurmeseCajunCambodianCanadianCape VerdeanCarpatho RusynCelticCentral AmericanCentral American IndianCherokeeCheyenneChickasawChileanChineseChippewaChoctawColombianColvilleCosta RicanCreeCreekCroatianCrowCubanCypriotCzechCzechoslovakianDanishDelawareDominicanDutchDutch West IndianEastern EuropeanEcuadorianEgyptianEnglishEstonianEthiopianEuropeanFijianFilipinoFinnishFrenchFrench American IndianFrench CanadianGermanGerman RussianGhanaianGreekGuamanian/ChamorroGuatemalanGuyaneseHaitianHmongHonduranHopiHoumaHungarianIcelanderIndian (Asian)IndonesianInupiatIranianIraqiIrishIroquoisIsraeliItalianJamaicanJapaneseJordanianKenyanKiowaKoreanLaotianLatvianLebaneseLiberianLithuanianLumbeeLuxembourgerMacedonianMalaysianMalteseMarshalleseMenomineeMexicanMexican American IndianMongolianMoroccanNative HawaiianNavajoNepaleseNew ZealanderNicaraguanNigerianNorthern EuropeanNorwegianOkinawanOsageOttawaPaiutePakistaniPalestinianPanamanianParaguayanPennsylvania GermanPeruvianPimaPolishPortuguesePotawatomiPuebloPuerto RicanPuget Sound SalishRomanianRussianSalvadoranSamoanScandinavianScotch-IrishScottishSeminoleSenegaleseSerbianShoshoneSierra LeoneanSiouxSlavicSlovakSloveneSomaliSouth AfricanSouth AmericanSouth American IndianSoviet UnionSpaniardSpanishSpanish AmericanSpanish American IndianSri LankanSubsaharan AfricanSudaneseSwedishSwissSyrianTaiwaneseThaiTlingit-HaidaTohono O'OdhamTonganTrinidadian and TobagonianTsimshianTurkishU.S. Virgin IslanderUgandanUkrainianUruguayanUteVenezuelanVietnameseWelshWest IndianYakamaYaquiYugoslavianYumanYup'ikZimbabwean
Immigration
NonimmigrantsImmigrantsAfghanistanAfricaAlbaniaArgentinaArmeniaAsiaAustraliaAustriaBahamasBangladeshBarbadosBelarusBelgiumBelizeBoliviaBosnia and HerzegovinaBrazilBulgariaBurma/MyanmarCabo VerdeCambodiaCameroonCanadaCaribbeanCentral AmericaChileChinaColombiaCongoCosta RicaCroatiaCubaCzechoslovakiaDenmarkDominicaDominican RepublicEastern AfricaEastern AsiaEastern EuropeEcuadorEgyptEl SalvadorEnglandEritreaEthiopiaEuropeFijiFranceGermanyGhanaGreeceGrenadaGuatemalaGuyanaHaitiHondurasHong KongHungaryIndiaIndonesiaIranIraqIrelandIsraelItalyJamaicaJapanJordanKazakhstanKenyaKoreaKuwaitLaosLatin AmericaLatviaLebanonLiberiaLithuaniaMalaysiaMexicoMicronesiaMiddle AfricaMoldovaMoroccoNepalNetherlandsNicaraguaNigeriaNorth AmericaNorth MacedoniaNorthern AfricaNorthern EuropeNorwayOceaniaPakistanPanamaPeruPhilippinesPolandPortugalRomaniaRussiaSaudi ArabiaScotlandSenegalSerbiaSierra LeoneSingaporeSomaliaSouth AfricaSouth AmericaSouth Central AsiaSouth Eastern AsiaSouthern EuropeSpainSri LankaSt. Vincent and the GrenadinesSudanSwedenSwitzerlandSyriaTaiwanThailandTrinidad and TobagoTurkeyUgandaUkraineUruguayUzbekistanVenezuelaVietnamWest IndiesWestern AfricaWestern AsiaWestern EuropeYemenZaireZimbabweAzores
Comanche
Race
Ancestry
AfghanAfricanAlaska NativeAlaskan AthabascanAlbanianAleutAlsatianAmericanApacheArabArapahoArgentineanArmenianAssyrian/Chaldean/SyriacAustralianAustrianBahamianBangladeshiBarbadianBasqueBelgianBelizeanBermudanBhutaneseBlackfeetBolivianBrazilianBritishBritish West IndianBulgarianBurmeseCajunCambodianCanadianCape VerdeanCarpatho RusynCelticCentral AmericanCentral American IndianCherokeeCheyenneChickasawChileanChineseChippewaChoctawColombianColvilleComancheCosta RicanCreeCreekCroatianCrowCubanCypriotCzechCzechoslovakianDanishDelawareDominicanDutchDutch West IndianEastern EuropeanEcuadorianEgyptianEnglishEstonianEthiopianEuropeanFijianFilipinoFinnishFrenchFrench American IndianFrench CanadianGermanGerman RussianGhanaianGreekGuamanian/ChamorroGuatemalanGuyaneseHaitianHmongHonduranHopiHoumaHungarianIcelanderIndian (Asian)IndonesianInupiatIranianIraqiIrishIroquoisIsraeliItalianJamaicanJapaneseJordanianKenyanKiowaKoreanLaotianLatvianLebaneseLiberianLithuanianLumbeeLuxembourgerMacedonianMalaysianMalteseMarshalleseMenomineeMexicanMexican American IndianMongolianMoroccanNative HawaiianNavajoNepaleseNew ZealanderNicaraguanNigerianNorthern EuropeanNorwegianOkinawanOsageOttawaPaiutePakistaniPalestinianPanamanianParaguayanPennsylvania GermanPeruvianPimaPolishPortuguesePotawatomiPuebloPuerto RicanPuget Sound SalishRomanianRussianSalvadoranSamoanScandinavianScotch-IrishScottishSeminoleSenegaleseSerbianShoshoneSierra LeoneanSiouxSlavicSlovakSloveneSomaliSouth AfricanSouth AmericanSouth American IndianSoviet UnionSpaniardSpanishSpanish AmericanSpanish American IndianSri LankanSubsaharan AfricanSudaneseSwedishSwissSyrianTaiwaneseThaiTlingit-HaidaTohono O'OdhamTonganTrinidadian and TobagonianTsimshianTurkishU.S. Virgin IslanderUgandanUkrainianUruguayanUteVenezuelanVietnameseWelshWest IndianYakamaYaquiYugoslavianYumanYup'ikZimbabwean
Immigration
NonimmigrantsImmigrantsAfghanistanAfricaAlbaniaArgentinaArmeniaAsiaAustraliaAustriaBahamasBangladeshBarbadosBelarusBelgiumBelizeBoliviaBosnia and HerzegovinaBrazilBulgariaBurma/MyanmarCabo VerdeCambodiaCameroonCanadaCaribbeanCentral AmericaChileChinaColombiaCongoCosta RicaCroatiaCubaCzechoslovakiaDenmarkDominicaDominican RepublicEastern AfricaEastern AsiaEastern EuropeEcuadorEgyptEl SalvadorEnglandEritreaEthiopiaEuropeFranceGermanyGhanaGreeceGrenadaGuatemalaGuyanaHaitiHondurasHong KongHungaryIndiaIndonesiaIranIraqIrelandIsraelItalyJamaicaJapanJordanKazakhstanKenyaKoreaKuwaitLaosLatin AmericaLatviaLebanonLiberiaLithuaniaMalaysiaMexicoMicronesiaMiddle AfricaMoldovaMoroccoNepalNetherlandsNicaraguaNigeriaNorth AmericaNorth MacedoniaNorthern AfricaNorthern EuropeNorwayOceaniaPakistanPanamaPeruPhilippinesPolandPortugalRomaniaRussiaSaudi ArabiaScotlandSenegalSerbiaSierra LeoneSingaporeSomaliaSouth AfricaSouth AmericaSouth Central AsiaSouth Eastern AsiaSouthern EuropeSpainSri LankaSt. Vincent and the GrenadinesSudanSwedenSwitzerlandSyriaTaiwanThailandTrinidad and TobagoTurkeyUgandaUkraineUruguayUzbekistanVenezuelaVietnamWest IndiesWestern AfricaWestern AsiaWestern EuropeYemenZaireZimbabweAzores
Child Poverty Under the Age of 16
Income
Poverty
Unemployment
Labor Participation
Family Structure
Vehicle Availability
Education Level
Disability

Child Poverty Under the Age of 16 Comparison

Immigrants from Fiji

Comanche

Good
Tragic
15.8%
CHILD POVERTY UNDER THE AGE OF 16
71.1/ 100
METRIC RATING
159th/ 347
METRIC RANK
19.9%
CHILD POVERTY UNDER THE AGE OF 16
0.0/ 100
METRIC RATING
280th/ 347
METRIC RANK

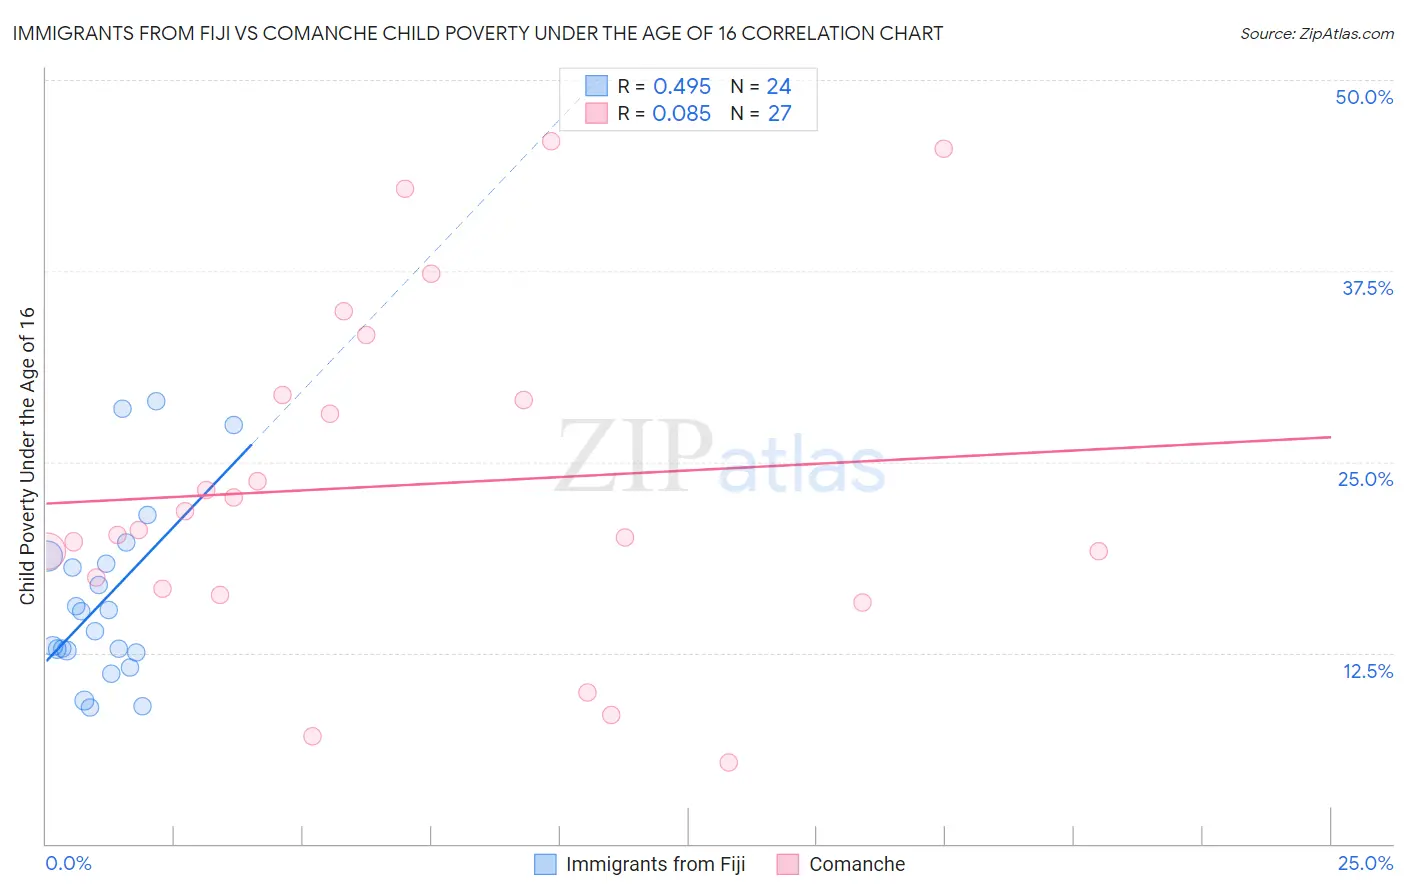
Immigrants from Fiji vs Comanche Child Poverty Under the Age of 16 Correlation Chart

The statistical analysis conducted on geographies consisting of 93,637,524 people shows a moderate positive correlation between the proportion of Immigrants from Fiji and poverty level among children under the age of 16 in the United States with a correlation coefficient (R) of 0.495 and weighted average of 15.8%. Similarly, the statistical analysis conducted on geographies consisting of 109,572,547 people shows a slight positive correlation between the proportion of Comanche and poverty level among children under the age of 16 in the United States with a correlation coefficient (R) of 0.085 and weighted average of 19.9%, a difference of 26.3%.
Immigrants from Fiji vs Comanche Child Poverty Under the Age of 16

Child Poverty Under the Age of 16 Correlation Summary

MeasurementImmigrants from FijiComanche
Minimum8.9%5.4%
Maximum28.9%46.0%
Range20.0%40.6%
Mean16.0%23.5%
Median14.5%20.5%
Interquartile 25% (IQ1)12.6%16.7%
Interquartile 75% (IQ3)18.6%29.3%
Interquartile Range (IQR)6.0%12.6%
Standard Deviation (Sample)5.8%11.0%
Standard Deviation (Population)5.7%10.8%

Similar Demographics by Child Poverty Under the Age of 16

Demographics Similar to Immigrants from Fiji by Child Poverty Under the Age of 16

In terms of child poverty under the age of 16, the demographic groups most similar to Immigrants from Fiji are Immigrants from Albania (15.8%, a difference of 0.070%), Immigrants from Chile (15.7%, a difference of 0.26%), Immigrants from Nepal (15.7%, a difference of 0.27%), Immigrants from Northern Africa (15.8%, a difference of 0.45%), and Colombian (15.8%, a difference of 0.51%).
DemographicsRating | RankChild Poverty Under the Age of 16
French Canadians
78.2
/100
|
#152
Good
15.6%
Venezuelans
77.4
/100
|
#153
Good
15.6%
Samoans
77.3
/100
|
#154
Good
15.6%
Syrians
76.1
/100
|
#155
Good
15.6%
Immigrants | Venezuela
74.9
/100
|
#156
Good
15.7%
Immigrants | Nepal
72.9
/100
|
#157
Good
15.7%
Immigrants | Chile
72.8
/100
|
#158
Good
15.7%
Immigrants | Fiji
71.1
/100
|
#159
Good
15.8%
Immigrants | Albania
70.7
/100
|
#160
Good
15.8%
Immigrants | Northern Africa
68.1
/100
|
#161
Good
15.8%
Colombians
67.6
/100
|
#162
Good
15.8%
Yugoslavians
67.6
/100
|
#163
Good
15.8%
Immigrants | Germany
67.3
/100
|
#164
Good
15.8%
Guamanians/Chamorros
66.4
/100
|
#165
Good
15.9%
Immigrants | Oceania
65.4
/100
|
#166
Good
15.9%

Demographics Similar to Comanche by Child Poverty Under the Age of 16

In terms of child poverty under the age of 16, the demographic groups most similar to Comanche are Bangladeshi (19.9%, a difference of 0.010%), Subsaharan African (19.9%, a difference of 0.010%), Iroquois (19.9%, a difference of 0.11%), Immigrants from Cabo Verde (19.9%, a difference of 0.25%), and Immigrants from Barbados (19.9%, a difference of 0.25%).
DemographicsRating | RankChild Poverty Under the Age of 16
Immigrants | Jamaica
0.1
/100
|
#273
Tragic
19.8%
Immigrants | Cabo Verde
0.1
/100
|
#274
Tragic
19.9%
Immigrants | Barbados
0.1
/100
|
#275
Tragic
19.9%
Belizeans
0.1
/100
|
#276
Tragic
19.9%
Iroquois
0.1
/100
|
#277
Tragic
19.9%
Bangladeshis
0.0
/100
|
#278
Tragic
19.9%
Sub-Saharan Africans
0.0
/100
|
#279
Tragic
19.9%
Comanche
0.0
/100
|
#280
Tragic
19.9%
Central Americans
0.0
/100
|
#281
Tragic
20.0%
Barbadians
0.0
/100
|
#282
Tragic
20.0%
Immigrants | Zaire
0.0
/100
|
#283
Tragic
20.1%
West Indians
0.0
/100
|
#284
Tragic
20.1%
Immigrants | St. Vincent and the Grenadines
0.0
/100
|
#285
Tragic
20.1%
Immigrants | West Indies
0.0
/100
|
#286
Tragic
20.2%
Blackfeet
0.0
/100
|
#287
Tragic
20.2%