Immigrants from Europe vs Ugandan Male Poverty

COMPARE

Immigrants from Europe
Race
Ancestry
AfghanAfricanAlaska NativeAlaskan AthabascanAlbanianAleutAlsatianAmericanApacheArabArapahoArgentineanArmenianAssyrian/Chaldean/SyriacAustralianAustrianBahamianBangladeshiBarbadianBasqueBelgianBelizeanBermudanBhutaneseBlackfeetBolivianBrazilianBritishBritish West IndianBulgarianBurmeseCajunCambodianCanadianCape VerdeanCarpatho RusynCelticCentral AmericanCentral American IndianCherokeeCheyenneChickasawChileanChineseChippewaChoctawColombianColvilleComancheCosta RicanCreeCreekCroatianCrowCubanCypriotCzechCzechoslovakianDanishDelawareDominicanDutchDutch West IndianEastern EuropeanEcuadorianEgyptianEnglishEstonianEthiopianEuropeanFijianFilipinoFinnishFrenchFrench American IndianFrench CanadianGermanGerman RussianGhanaianGreekGuamanian/ChamorroGuatemalanGuyaneseHaitianHmongHonduranHopiHoumaHungarianIcelanderIndian (Asian)IndonesianInupiatIranianIraqiIrishIroquoisIsraeliItalianJamaicanJapaneseJordanianKenyanKiowaKoreanLaotianLatvianLebaneseLiberianLithuanianLumbeeLuxembourgerMacedonianMalaysianMalteseMarshalleseMenomineeMexicanMexican American IndianMongolianMoroccanNative HawaiianNavajoNepaleseNew ZealanderNicaraguanNigerianNorthern EuropeanNorwegianOkinawanOsageOttawaPaiutePakistaniPalestinianPanamanianParaguayanPennsylvania GermanPeruvianPimaPolishPortuguesePotawatomiPuebloPuerto RicanPuget Sound SalishRomanianRussianSalvadoranSamoanScandinavianScotch-IrishScottishSeminoleSenegaleseSerbianShoshoneSierra LeoneanSiouxSlavicSlovakSloveneSomaliSouth AfricanSouth AmericanSouth American IndianSoviet UnionSpaniardSpanishSpanish AmericanSpanish American IndianSri LankanSubsaharan AfricanSudaneseSwedishSwissSyrianTaiwaneseThaiTlingit-HaidaTohono O'OdhamTonganTrinidadian and TobagonianTsimshianTurkishU.S. Virgin IslanderUkrainianUruguayanUteVenezuelanVietnameseWelshWest IndianYakamaYaquiYugoslavianYumanYup'ikZimbabwean
Immigration
NonimmigrantsImmigrantsAfghanistanAfricaAlbaniaArgentinaArmeniaAsiaAustraliaAustriaBahamasBangladeshBarbadosBelarusBelgiumBelizeBoliviaBosnia and HerzegovinaBrazilBulgariaBurma/MyanmarCabo VerdeCambodiaCameroonCanadaCaribbeanCentral AmericaChileChinaColombiaCongoCosta RicaCroatiaCubaCzechoslovakiaDenmarkDominicaDominican RepublicEastern AfricaEastern AsiaEastern EuropeEcuadorEgyptEl SalvadorEnglandEritreaEthiopiaEuropeFijiFranceGermanyGhanaGreeceGrenadaGuatemalaGuyanaHaitiHondurasHong KongHungaryIndiaIndonesiaIranIraqIrelandIsraelItalyJamaicaJapanJordanKazakhstanKenyaKoreaKuwaitLaosLatin AmericaLatviaLebanonLiberiaLithuaniaMalaysiaMexicoMicronesiaMiddle AfricaMoldovaMoroccoNepalNetherlandsNicaraguaNigeriaNorth AmericaNorth MacedoniaNorthern AfricaNorthern EuropeNorwayOceaniaPakistanPanamaPeruPhilippinesPolandPortugalRomaniaRussiaSaudi ArabiaScotlandSenegalSerbiaSierra LeoneSingaporeSomaliaSouth AfricaSouth AmericaSouth Central AsiaSouth Eastern AsiaSouthern EuropeSpainSri LankaSt. Vincent and the GrenadinesSudanSwedenSwitzerlandSyriaTaiwanThailandTrinidad and TobagoTurkeyUgandaUkraineUruguayUzbekistanVenezuelaVietnamWest IndiesWestern AfricaWestern AsiaWestern EuropeYemenZaireZimbabweAzores
Ugandan
Race
Ancestry
AfghanAfricanAlaska NativeAlaskan AthabascanAlbanianAleutAlsatianAmericanApacheArabArapahoArgentineanArmenianAssyrian/Chaldean/SyriacAustralianAustrianBahamianBangladeshiBarbadianBasqueBelgianBelizeanBermudanBhutaneseBlackfeetBolivianBrazilianBritishBritish West IndianBulgarianBurmeseCajunCambodianCanadianCape VerdeanCarpatho RusynCelticCentral AmericanCentral American IndianCherokeeCheyenneChickasawChileanChineseChippewaChoctawColombianColvilleComancheCosta RicanCreeCreekCroatianCrowCubanCypriotCzechCzechoslovakianDanishDelawareDominicanDutchDutch West IndianEastern EuropeanEcuadorianEgyptianEnglishEstonianEthiopianEuropeanFijianFilipinoFinnishFrenchFrench American IndianFrench CanadianGermanGerman RussianGhanaianGreekGuamanian/ChamorroGuatemalanGuyaneseHaitianHmongHonduranHopiHoumaHungarianIcelanderIndian (Asian)IndonesianInupiatIranianIraqiIrishIroquoisIsraeliItalianJamaicanJapaneseJordanianKenyanKiowaKoreanLaotianLatvianLebaneseLiberianLithuanianLumbeeLuxembourgerMacedonianMalaysianMalteseMarshalleseMenomineeMexicanMexican American IndianMongolianMoroccanNative HawaiianNavajoNepaleseNew ZealanderNicaraguanNigerianNorthern EuropeanNorwegianOkinawanOsageOttawaPaiutePakistaniPalestinianPanamanianParaguayanPennsylvania GermanPeruvianPimaPolishPortuguesePotawatomiPuebloPuerto RicanPuget Sound SalishRomanianRussianSalvadoranSamoanScandinavianScotch-IrishScottishSeminoleSenegaleseSerbianShoshoneSierra LeoneanSiouxSlavicSlovakSloveneSomaliSouth AfricanSouth AmericanSouth American IndianSoviet UnionSpaniardSpanishSpanish AmericanSpanish American IndianSri LankanSubsaharan AfricanSudaneseSwedishSwissSyrianTaiwaneseThaiTlingit-HaidaTohono O'OdhamTonganTrinidadian and TobagonianTsimshianTurkishU.S. Virgin IslanderUgandanUkrainianUruguayanUteVenezuelanVietnameseWelshWest IndianYakamaYaquiYugoslavianYumanYup'ikZimbabwean
Immigration
NonimmigrantsImmigrantsAfghanistanAfricaAlbaniaArgentinaArmeniaAsiaAustraliaAustriaBahamasBangladeshBarbadosBelarusBelgiumBelizeBoliviaBosnia and HerzegovinaBrazilBulgariaBurma/MyanmarCabo VerdeCambodiaCameroonCanadaCaribbeanCentral AmericaChileChinaColombiaCongoCosta RicaCroatiaCubaCzechoslovakiaDenmarkDominicaDominican RepublicEastern AfricaEastern AsiaEastern EuropeEcuadorEgyptEl SalvadorEnglandEritreaEthiopiaFijiFranceGermanyGhanaGreeceGrenadaGuatemalaGuyanaHaitiHondurasHong KongHungaryIndiaIndonesiaIranIraqIrelandIsraelItalyJamaicaJapanJordanKazakhstanKenyaKoreaKuwaitLaosLatin AmericaLatviaLebanonLiberiaLithuaniaMalaysiaMexicoMicronesiaMiddle AfricaMoldovaMoroccoNepalNetherlandsNicaraguaNigeriaNorth AmericaNorth MacedoniaNorthern AfricaNorthern EuropeNorwayOceaniaPakistanPanamaPeruPhilippinesPolandPortugalRomaniaRussiaSaudi ArabiaScotlandSenegalSerbiaSierra LeoneSingaporeSomaliaSouth AfricaSouth AmericaSouth Central AsiaSouth Eastern AsiaSouthern EuropeSpainSri LankaSt. Vincent and the GrenadinesSudanSwedenSwitzerlandSyriaTaiwanThailandTrinidad and TobagoTurkeyUgandaUkraineUruguayUzbekistanVenezuelaVietnamWest IndiesWestern AfricaWestern AsiaWestern EuropeYemenZaireZimbabweAzores
Male Poverty
Income
Poverty
Unemployment
Labor Participation
Family Structure
Vehicle Availability
Education Level
Disability

Male Poverty Comparison

Immigrants from Europe

Ugandans

Exceptional
Tragic
10.1%
MALE POVERTY
97.9/ 100
METRIC RATING
59th/ 347
METRIC RANK
12.2%
MALE POVERTY
2.2/ 100
METRIC RATING
221st/ 347
METRIC RANK

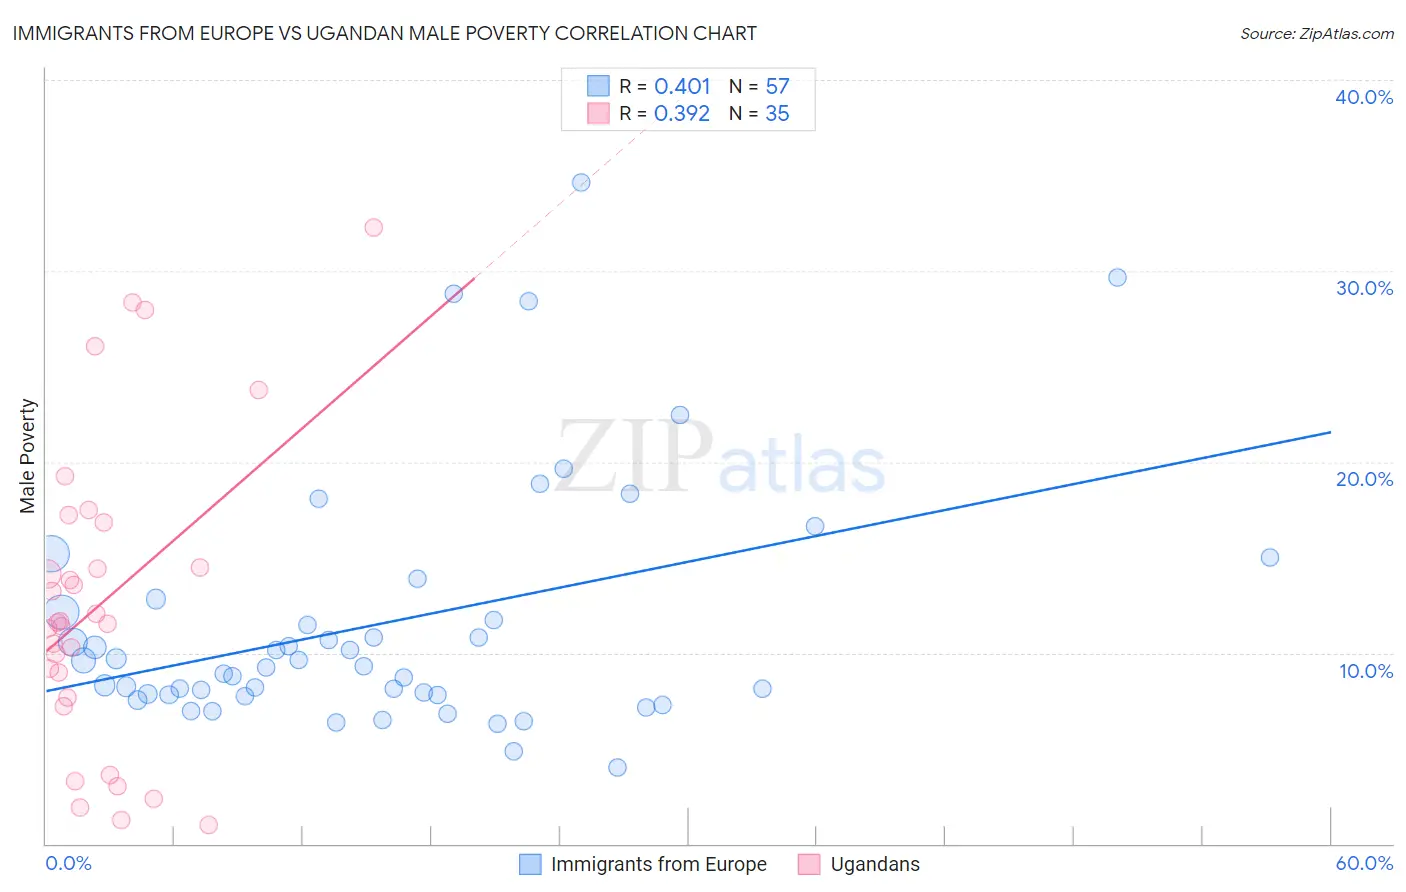
Immigrants from Europe vs Ugandan Male Poverty Correlation Chart

The statistical analysis conducted on geographies consisting of 546,187,630 people shows a moderate positive correlation between the proportion of Immigrants from Europe and poverty level among males in the United States with a correlation coefficient (R) of 0.401 and weighted average of 10.1%. Similarly, the statistical analysis conducted on geographies consisting of 93,987,101 people shows a mild positive correlation between the proportion of Ugandans and poverty level among males in the United States with a correlation coefficient (R) of 0.392 and weighted average of 12.2%, a difference of 20.7%.
Immigrants from Europe vs Ugandan Male Poverty

Male Poverty Correlation Summary

MeasurementImmigrants from EuropeUgandan
Minimum4.0%0.96%
Maximum34.6%32.3%
Range30.6%31.3%
Mean11.6%12.6%
Median9.3%11.6%
Interquartile 25% (IQ1)7.8%7.6%
Interquartile 75% (IQ3)12.5%16.8%
Interquartile Range (IQR)4.7%9.2%
Standard Deviation (Sample)6.5%7.9%
Standard Deviation (Population)6.4%7.8%

Similar Demographics by Male Poverty

Demographics Similar to Immigrants from Europe by Male Poverty

In terms of male poverty, the demographic groups most similar to Immigrants from Europe are Ukrainian (10.1%, a difference of 0.090%), Austrian (10.1%, a difference of 0.11%), Scandinavian (10.1%, a difference of 0.13%), Immigrants from Italy (10.2%, a difference of 0.20%), and Estonian (10.1%, a difference of 0.21%).
DemographicsRating | RankMale Poverty
Asians
98.7
/100
|
#52
Exceptional
10.0%
Immigrants | Czechoslovakia
98.6
/100
|
#53
Exceptional
10.0%
Immigrants | Austria
98.5
/100
|
#54
Exceptional
10.0%
Germans
98.3
/100
|
#55
Exceptional
10.1%
Immigrants | Bulgaria
98.2
/100
|
#56
Exceptional
10.1%
Estonians
98.1
/100
|
#57
Exceptional
10.1%
Scandinavians
98.0
/100
|
#58
Exceptional
10.1%
Immigrants | Europe
97.9
/100
|
#59
Exceptional
10.1%
Ukrainians
97.9
/100
|
#60
Exceptional
10.1%
Austrians
97.8
/100
|
#61
Exceptional
10.1%
Immigrants | Italy
97.8
/100
|
#62
Exceptional
10.2%
Slovaks
97.7
/100
|
#63
Exceptional
10.2%
Swiss
97.5
/100
|
#64
Exceptional
10.2%
Zimbabweans
97.5
/100
|
#65
Exceptional
10.2%
Serbians
97.5
/100
|
#66
Exceptional
10.2%

Demographics Similar to Ugandans by Male Poverty

In terms of male poverty, the demographic groups most similar to Ugandans are Immigrants from Africa (12.2%, a difference of 0.020%), Immigrants from Micronesia (12.2%, a difference of 0.040%), Immigrants from Eritrea (12.2%, a difference of 0.21%), Bermudan (12.2%, a difference of 0.23%), and German Russian (12.2%, a difference of 0.29%).
DemographicsRating | RankMale Poverty
Japanese
2.7
/100
|
#214
Tragic
12.2%
Immigrants | Uzbekistan
2.6
/100
|
#215
Tragic
12.2%
Immigrants | Cambodia
2.5
/100
|
#216
Tragic
12.2%
Immigrants | Thailand
2.5
/100
|
#217
Tragic
12.2%
German Russians
2.5
/100
|
#218
Tragic
12.2%
Bermudans
2.4
/100
|
#219
Tragic
12.2%
Immigrants | Eritrea
2.4
/100
|
#220
Tragic
12.2%
Ugandans
2.2
/100
|
#221
Tragic
12.2%
Immigrants | Africa
2.1
/100
|
#222
Tragic
12.2%
Immigrants | Micronesia
2.1
/100
|
#223
Tragic
12.2%
Immigrants | Nigeria
1.6
/100
|
#224
Tragic
12.3%
Osage
1.5
/100
|
#225
Tragic
12.3%
Nigerians
1.4
/100
|
#226
Tragic
12.3%
Alaska Natives
1.4
/100
|
#227
Tragic
12.4%
Alsatians
1.3
/100
|
#228
Tragic
12.4%