Immigrants from Europe vs Salvadoran Seniors Poverty Over the Age of 75
COMPARE
Immigrants from Europe
Salvadoran
Seniors Poverty Over the Age of 75
Seniors Poverty Over the Age of 75 Comparison
Immigrants from Europe
Salvadorans
12.2%
SENIORS POVERTY OVER THE AGE OF 75
50.0/ 100
METRIC RATING
174th/ 347
METRIC RANK
14.2%
SENIORS POVERTY OVER THE AGE OF 75
0.0/ 100
METRIC RATING
265th/ 347
METRIC RANK
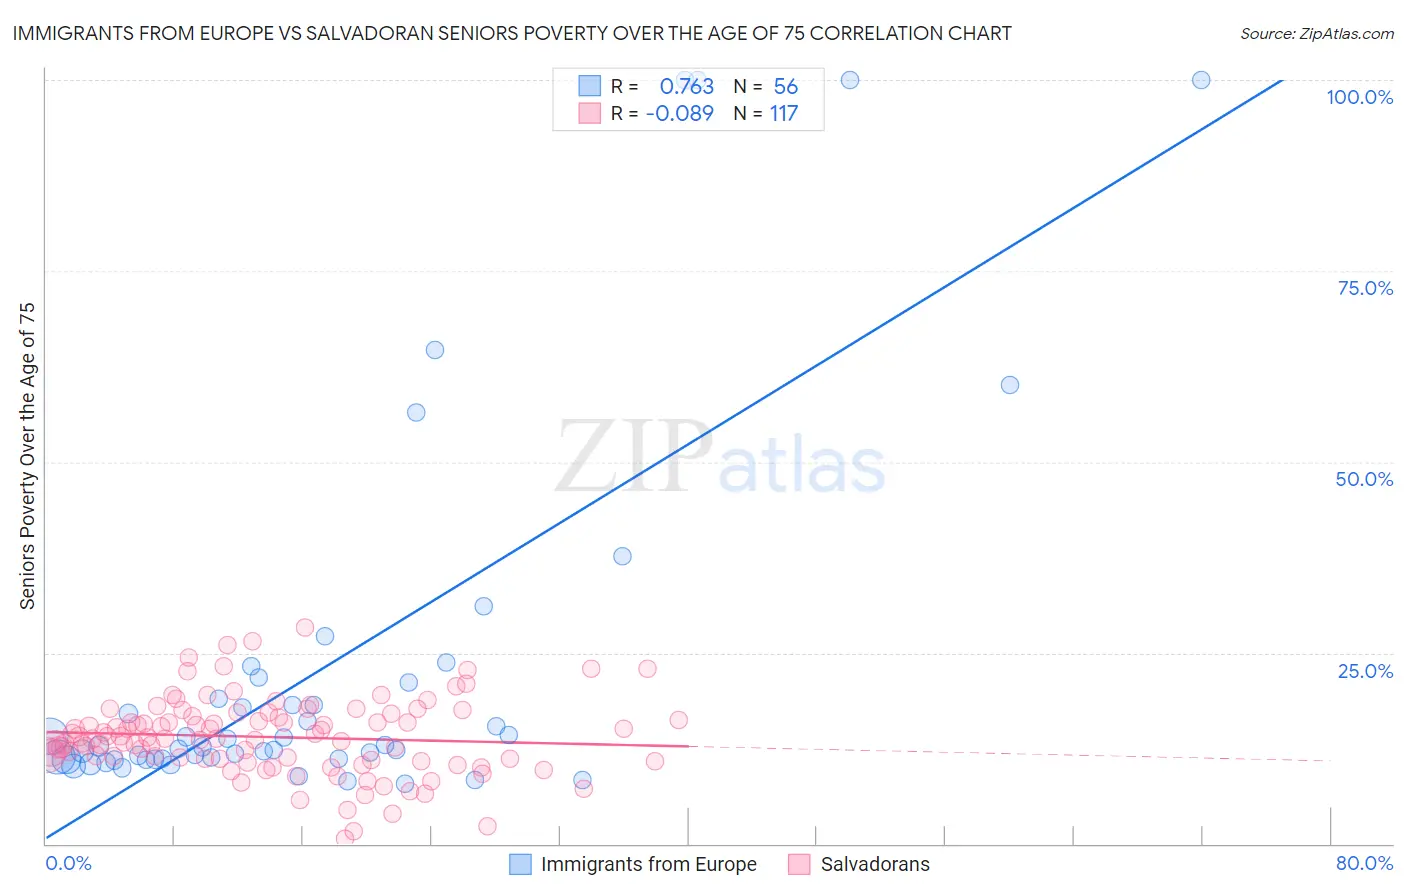
Immigrants from Europe vs Salvadoran Seniors Poverty Over the Age of 75 Correlation Chart
The statistical analysis conducted on geographies consisting of 534,137,769 people shows a strong positive correlation between the proportion of Immigrants from Europe and poverty level among seniors over the age of 75 in the United States with a correlation coefficient (R) of 0.763 and weighted average of 12.2%. Similarly, the statistical analysis conducted on geographies consisting of 394,162,125 people shows a slight negative correlation between the proportion of Salvadorans and poverty level among seniors over the age of 75 in the United States with a correlation coefficient (R) of -0.089 and weighted average of 14.2%, a difference of 16.3%.
Seniors Poverty Over the Age of 75 Correlation Summary
| Measurement | Immigrants from Europe | Salvadoran |
| Minimum | 7.9% | 0.60% |
| Maximum | 100.0% | 28.3% |
| Range | 92.1% | 27.7% |
| Mean | 23.0% | 14.0% |
| Median | 12.7% | 13.8% |
| Interquartile 25% (IQ1) | 11.1% | 11.0% |
| Interquartile 75% (IQ3) | 20.0% | 16.9% |
| Interquartile Range (IQR) | 8.9% | 5.9% |
| Standard Deviation (Sample) | 24.6% | 5.0% |
| Standard Deviation (Population) | 24.4% | 5.0% |
Similar Demographics by Seniors Poverty Over the Age of 75
Demographics Similar to Immigrants from Europe by Seniors Poverty Over the Age of 75
In terms of seniors poverty over the age of 75, the demographic groups most similar to Immigrants from Europe are Arab (12.2%, a difference of 0.040%), Immigrants from Saudi Arabia (12.2%, a difference of 0.040%), Immigrants from Fiji (12.2%, a difference of 0.12%), Spaniard (12.2%, a difference of 0.13%), and Immigrants from Thailand (12.2%, a difference of 0.16%).
| Demographics | Rating | Rank | Seniors Poverty Over the Age of 75 |
| Immigrants | Switzerland | 54.5 /100 | #167 | Average 12.1% |
| Immigrants | Syria | 53.9 /100 | #168 | Average 12.2% |
| Immigrants | Egypt | 53.7 /100 | #169 | Average 12.2% |
| Immigrants | Thailand | 52.0 /100 | #170 | Average 12.2% |
| Spaniards | 51.6 /100 | #171 | Average 12.2% |
| Immigrants | Fiji | 51.5 /100 | #172 | Average 12.2% |
| Arabs | 50.5 /100 | #173 | Average 12.2% |
| Immigrants | Europe | 50.0 /100 | #174 | Average 12.2% |
| Immigrants | Saudi Arabia | 49.5 /100 | #175 | Average 12.2% |
| Immigrants | Iran | 48.1 /100 | #176 | Average 12.2% |
| Immigrants | Asia | 47.8 /100 | #177 | Average 12.2% |
| Immigrants | Nonimmigrants | 46.8 /100 | #178 | Average 12.2% |
| Mongolians | 45.5 /100 | #179 | Average 12.2% |
| Immigrants | South Eastern Asia | 44.3 /100 | #180 | Average 12.2% |
| Immigrants | Australia | 44.2 /100 | #181 | Average 12.2% |
Demographics Similar to Salvadorans by Seniors Poverty Over the Age of 75
In terms of seniors poverty over the age of 75, the demographic groups most similar to Salvadorans are Armenian (14.2%, a difference of 0.22%), South American (14.1%, a difference of 0.24%), Venezuelan (14.2%, a difference of 0.24%), Colombian (14.3%, a difference of 0.58%), and Immigrants from Venezuela (14.3%, a difference of 0.69%).
| Demographics | Rating | Rank | Seniors Poverty Over the Age of 75 |
| Immigrants | Panama | 0.1 /100 | #258 | Tragic 13.9% |
| Immigrants | Portugal | 0.1 /100 | #259 | Tragic 13.9% |
| Immigrants | Immigrants | 0.1 /100 | #260 | Tragic 13.9% |
| Ghanaians | 0.1 /100 | #261 | Tragic 14.0% |
| Cajuns | 0.1 /100 | #262 | Tragic 14.0% |
| Iroquois | 0.1 /100 | #263 | Tragic 14.0% |
| South Americans | 0.0 /100 | #264 | Tragic 14.1% |
| Salvadorans | 0.0 /100 | #265 | Tragic 14.2% |
| Armenians | 0.0 /100 | #266 | Tragic 14.2% |
| Venezuelans | 0.0 /100 | #267 | Tragic 14.2% |
| Colombians | 0.0 /100 | #268 | Tragic 14.3% |
| Immigrants | Venezuela | 0.0 /100 | #269 | Tragic 14.3% |
| Immigrants | Uruguay | 0.0 /100 | #270 | Tragic 14.3% |
| Immigrants | Ghana | 0.0 /100 | #271 | Tragic 14.4% |
| Mexicans | 0.0 /100 | #272 | Tragic 14.4% |