Immigrants from Europe vs Ottawa Child Poverty Among Girls Under 16
COMPARE
Immigrants from Europe
Ottawa
Child Poverty Among Girls Under 16
Child Poverty Among Girls Under 16 Comparison
Immigrants from Europe
Ottawa
14.4%
CHILD POVERTY AMONG GIRLS UNDER 16
98.7/ 100
METRIC RATING
63rd/ 347
METRIC RANK
19.4%
CHILD POVERTY AMONG GIRLS UNDER 16
0.2/ 100
METRIC RATING
259th/ 347
METRIC RANK
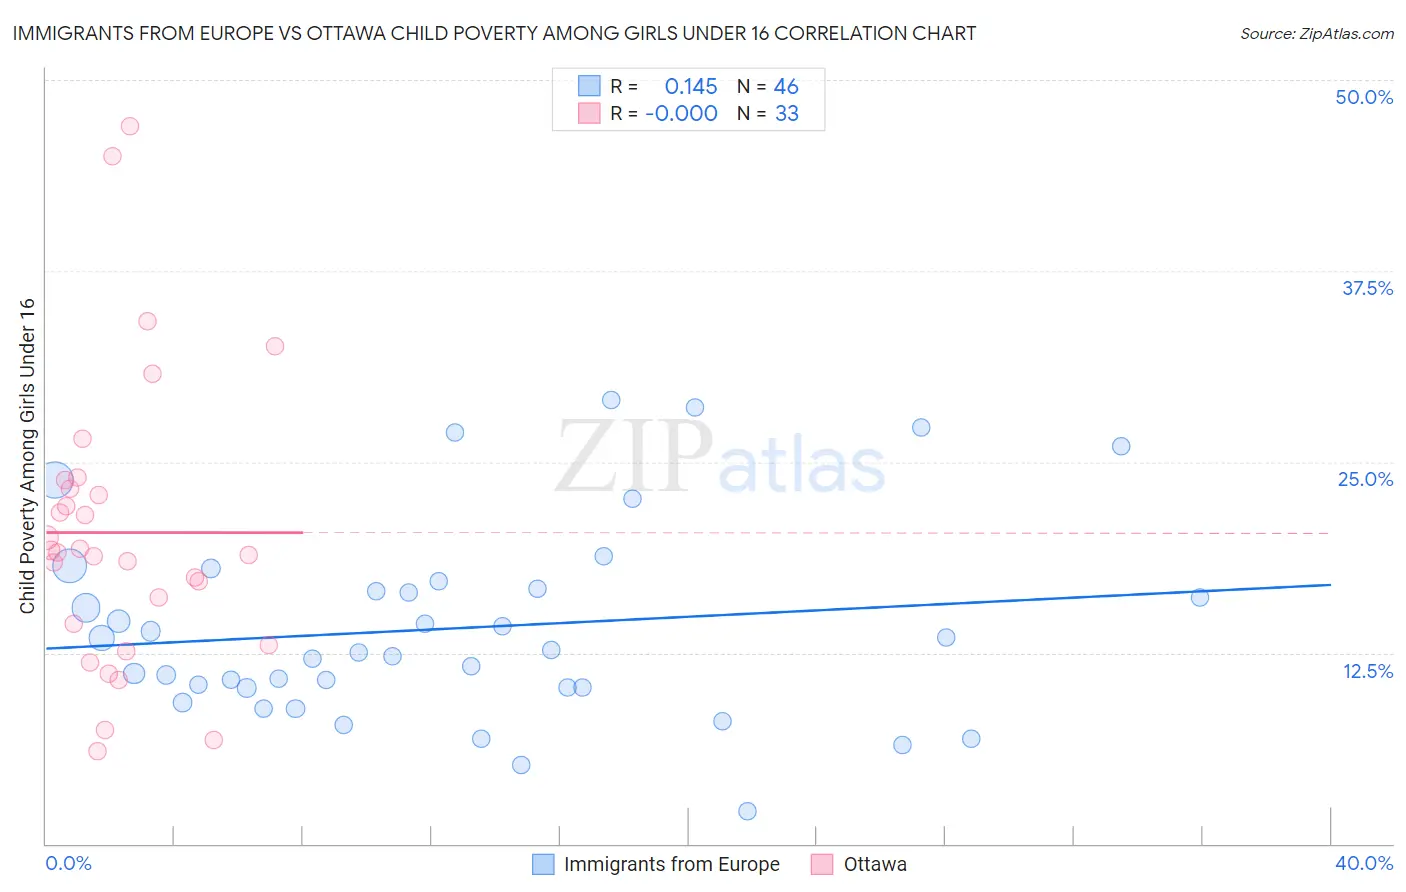
Immigrants from Europe vs Ottawa Child Poverty Among Girls Under 16 Correlation Chart
The statistical analysis conducted on geographies consisting of 528,272,896 people shows a poor positive correlation between the proportion of Immigrants from Europe and poverty level among girls under the age of 16 in the United States with a correlation coefficient (R) of 0.145 and weighted average of 14.4%. Similarly, the statistical analysis conducted on geographies consisting of 49,714,849 people shows no correlation between the proportion of Ottawa and poverty level among girls under the age of 16 in the United States with a correlation coefficient (R) of -0.000 and weighted average of 19.4%, a difference of 34.4%.
Child Poverty Among Girls Under 16 Correlation Summary
| Measurement | Immigrants from Europe | Ottawa |
| Minimum | 2.1% | 6.1% |
| Maximum | 29.0% | 46.9% |
| Range | 26.9% | 40.9% |
| Mean | 14.1% | 20.4% |
| Median | 12.6% | 19.1% |
| Interquartile 25% (IQ1) | 10.2% | 13.7% |
| Interquartile 75% (IQ3) | 16.7% | 23.6% |
| Interquartile Range (IQR) | 6.5% | 9.9% |
| Standard Deviation (Sample) | 6.4% | 9.4% |
| Standard Deviation (Population) | 6.3% | 9.3% |
Similar Demographics by Child Poverty Among Girls Under 16
Demographics Similar to Immigrants from Europe by Child Poverty Among Girls Under 16
In terms of child poverty among girls under 16, the demographic groups most similar to Immigrants from Europe are Scandinavian (14.4%, a difference of 0.050%), Immigrants from Philippines (14.4%, a difference of 0.11%), Immigrants from Sweden (14.5%, a difference of 0.14%), Polish (14.4%, a difference of 0.16%), and Cambodian (14.4%, a difference of 0.16%).
| Demographics | Rating | Rank | Child Poverty Among Girls Under 16 |
| Immigrants | Indonesia | 98.9 /100 | #56 | Exceptional 14.4% |
| Immigrants | Serbia | 98.9 /100 | #57 | Exceptional 14.4% |
| Immigrants | Bulgaria | 98.8 /100 | #58 | Exceptional 14.4% |
| Zimbabweans | 98.8 /100 | #59 | Exceptional 14.4% |
| Poles | 98.7 /100 | #60 | Exceptional 14.4% |
| Cambodians | 98.7 /100 | #61 | Exceptional 14.4% |
| Scandinavians | 98.7 /100 | #62 | Exceptional 14.4% |
| Immigrants | Europe | 98.7 /100 | #63 | Exceptional 14.4% |
| Immigrants | Philippines | 98.6 /100 | #64 | Exceptional 14.4% |
| Immigrants | Sweden | 98.6 /100 | #65 | Exceptional 14.5% |
| Immigrants | Belgium | 98.5 /100 | #66 | Exceptional 14.5% |
| Laotians | 98.4 /100 | #67 | Exceptional 14.5% |
| Immigrants | Argentina | 98.3 /100 | #68 | Exceptional 14.6% |
| Immigrants | Poland | 98.2 /100 | #69 | Exceptional 14.6% |
| Europeans | 98.1 /100 | #70 | Exceptional 14.6% |
Demographics Similar to Ottawa by Child Poverty Among Girls Under 16
In terms of child poverty among girls under 16, the demographic groups most similar to Ottawa are Salvadoran (19.4%, a difference of 0.10%), Guyanese (19.4%, a difference of 0.23%), Trinidadian and Tobagonian (19.3%, a difference of 0.47%), Immigrants from Ecuador (19.3%, a difference of 0.54%), and Immigrants from Western Africa (19.3%, a difference of 0.56%).
| Demographics | Rating | Rank | Child Poverty Among Girls Under 16 |
| Immigrants | Middle Africa | 0.3 /100 | #252 | Tragic 19.2% |
| Immigrants | Guyana | 0.3 /100 | #253 | Tragic 19.3% |
| Immigrants | Western Africa | 0.3 /100 | #254 | Tragic 19.3% |
| Immigrants | Ecuador | 0.3 /100 | #255 | Tragic 19.3% |
| Trinidadians and Tobagonians | 0.2 /100 | #256 | Tragic 19.3% |
| Guyanese | 0.2 /100 | #257 | Tragic 19.4% |
| Salvadorans | 0.2 /100 | #258 | Tragic 19.4% |
| Ottawa | 0.2 /100 | #259 | Tragic 19.4% |
| Mexican American Indians | 0.2 /100 | #260 | Tragic 19.5% |
| Vietnamese | 0.2 /100 | #261 | Tragic 19.5% |
| Chickasaw | 0.1 /100 | #262 | Tragic 19.6% |
| Immigrants | Burma/Myanmar | 0.1 /100 | #263 | Tragic 19.7% |
| Jamaicans | 0.1 /100 | #264 | Tragic 19.7% |
| Immigrants | Jamaica | 0.1 /100 | #265 | Tragic 19.8% |
| Spanish Americans | 0.1 /100 | #266 | Tragic 19.8% |